

Euler’s Königsberg Bridges: How Simple Math Can Model Lateral Movement for Effective Microsegmentation
You may have seen the “no-lift pencil” puzzles online — challenges that ask you to draw a shape without lifting your pencil or retracing any lines. I solved a few of these on our whiteboard at home, much to my kids’ amazement. Of course, I had a trick up my sleeve: I was using math.
These puzzles trace back to a problem that intrigued the great mathematician Euler: The Königsberg Bridges Problem. It asked whether you could walk through the city of Königsberg, crossing each of its seven bridges exactly once and returning to the starting point. Euler solved it — and in the process, invented a whole new branch of math: graph theory.
Graph theory now powers everything from GPS navigation to network security. In this post, we’ll use it to better understand and stop lateral movement — how attackers jump from system to system — by applying simple math concepts like matrix multiplication and exponentiation.


The Theme: Simple Math Meets Cybersecurity
This blog continues our theme: using simple math to improve real-world cybersecurity. We’ll journey from Euler’s 18th-century challenge to MITRE’s modern network defense, exploring:
- Pencil puzzles and Königsberg bridges
- Graph theory and adjacency matrices
- Matrix multiplication and exponentiation
- MITRE ATT&CK and lateral movement
- Real-world segmentation of risky ports (like RDP 3389 vs Epic Cache 6966)
Pencil Puzzles, Graphs, and Bridges
Let’s start with a few fun shapes to build intuition:
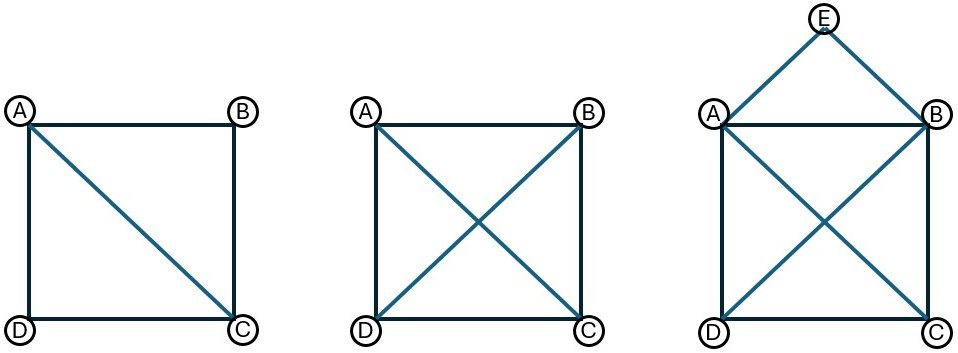
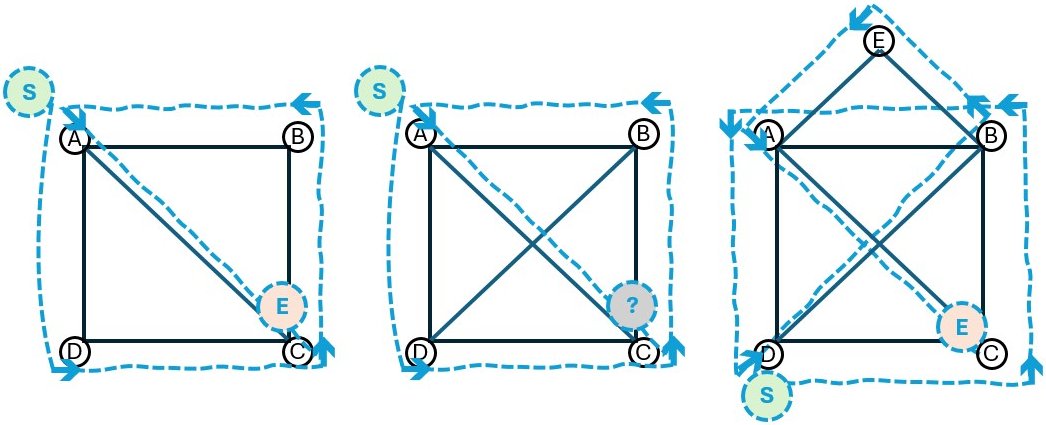
Shape 1: Square with one diagonal
Start at corner A or C, and you can draw the shape without lifting your pencil. Try from B or D, and you’ll get stuck.
Shape 2: Square with two diagonals
No matter where you start, you’ll get stuck before finishing all the lines.
Shape 3: Square with diagonals and a roof
Trickier still. You’ll likely need math to figure it out. It only works if you start at just the right point D or C — otherwise, at least one edge will always be left out.
These puzzles behave strangely — sometimes solvable, sometimes not. Let’s see how Euler approached this mystery.
Euler’s Königsberg Bridges
Euler modeled the city as a graph: labeled land masses as nodes, and bridges as edges. The problem became one of drawing a path through the graph, using each edge exactly once.
Euler’s insight:
- Any node with an odd number of edges must be the start or end of your path.
- A solution only exists if there are 0 or 2 nodes with an odd number of connections.
This simple rule lets you predict — mathematically — whether a pencil puzzle is solvable. Try it with your family!
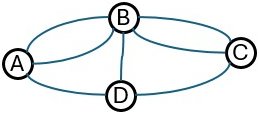
Graph Theory and Adjacency Matrix
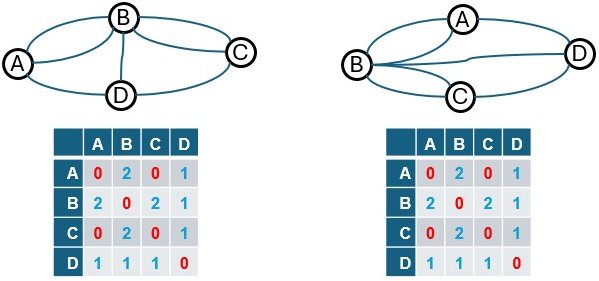
Graphs can look different on paper but represent the same structure. To analyze them consistently, we use a mathematical representation: the adjacency matrix.
Here’s how:
- Nodes (A, B, C, D) are the rows and columns of a square table.
- Each cell [row, column] shows how many edges connect the two nodes.
Example: If A has two connections to B, the cell [A, B] = 2. If there’s no connection between A and C, [A, C] = 0.
This matrix helps us do more than just describe a graph — it allows us to calculate paths through it.
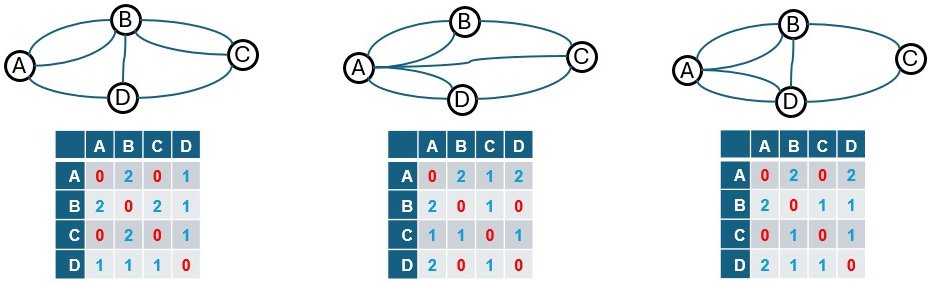
Let us follow this for the first graph
- Row A, Col A = 0, no looping edge to self
- Row A, Col B = 2, two edges
- Row A, Col C = 0, no connection
- Row A, Col D = 1, one edge
- Row B, Col A = 2, two edges
- Row B, Col B = 0, no looping edge to self
- Row B, Col C = 2, two edges
- Row B, Col D = 1, one edge
- Row C, Col A = 0, no connection
- Row C, Col B = 2, two edges
- Row C, Col C = 0, no looping edge to self
- Row C, Col D = 1, one edge
- Row D, Col A = 1, one edge
- Row D, Col B = 1, one edge
- Row D, Col C = 1, one edge
- Row D, Col D = 0, no looping edge to self
If you look closely, this matrix matches exactly with the one we created for the first graph. And if we follow the same process, we can generate the correct adjacency matrices for the other graphs as well.
Now here’s something interesting: if we simply relabel the nodes of the second graph (i.e., permute them), we can end up with the same adjacency matrix as the first one. That’s how we know — mathematically — that the two graphs are actually the same structure underneath. In graph theory terms, they’re called isomorphic.
And because their structure is the same, any pencil path (like our no-lift solution) that works for one will also work for the other.
Finding Paths: Matrix Multiplication and Lateral Movement
An adjacency matrix already shows all direct (1-hop) connections between nodes. But what if we want to find 2-hop or even longer paths?
Directed Graphs
In an undirected graph, the relationship goes both ways. So, if we see a 2 in the cell at Row A, Col B, it means there are two edges connecting A and B — and we’ll see the same 2 at Row B, Col A. That’s why the matrix looks symmetric along the diagonal — entries like [A, B] and [B, A] mirror each other.
This symmetry reflects mutual connectivity: if you can go from A to B, you can also come back from B to A.
But things change in a directed graph, where edges have direction — like one-way streets or client-server connections in a network. In those cases, the symmetry breaks.
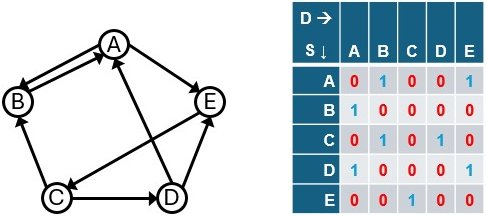
For example, in the above graph:
- Row A, Col E = 1 (meaning there’s a path from A to E)
- Row E, Col A = 0 (meaning there’s no path from E to A)
This directional structure is essential when modeling how attacks laterally move through a network.
Multi-hop Paths, Re-discovering Matrix Multiplication (and Exponentiation)
Attackers rarely stop after a single hop — they move laterally through a network, step by step, until they find their target. To understand these potential paths, we can use a mathematical tool that might feel familiar: matrix multiplication.
We’ll explore how squaring the adjacency matrix of a graph helps us uncover all length-two paths — that is, paths that go from one node to another in exactly two hops.
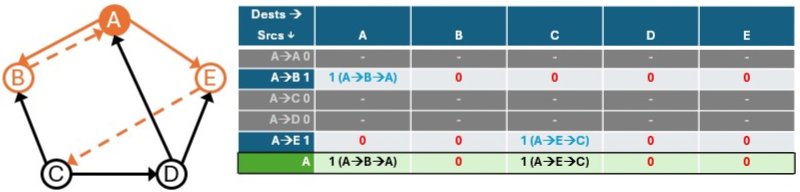
Step-by-Step Intuition
- Start at a Node (say A):
- Look at all nodes directly connected to A (i.e., all one-hop neighbors).
- For example: A → B and A → E
- Now look one more step ahead:
- From B and E, see where we can go next:
- B → A
- E → C
- From B and E, see where we can go next:
- We now have two-hop paths from A:
- A → B → A
- A → E → C
- These are the length-two paths starting from A
- Matrix View:
- The adjacency matrix represents all one-hop connections.
- This new row we created following the above steps created all two-hop connections
- If we repeat this process, we would essentially create the two hop matrix
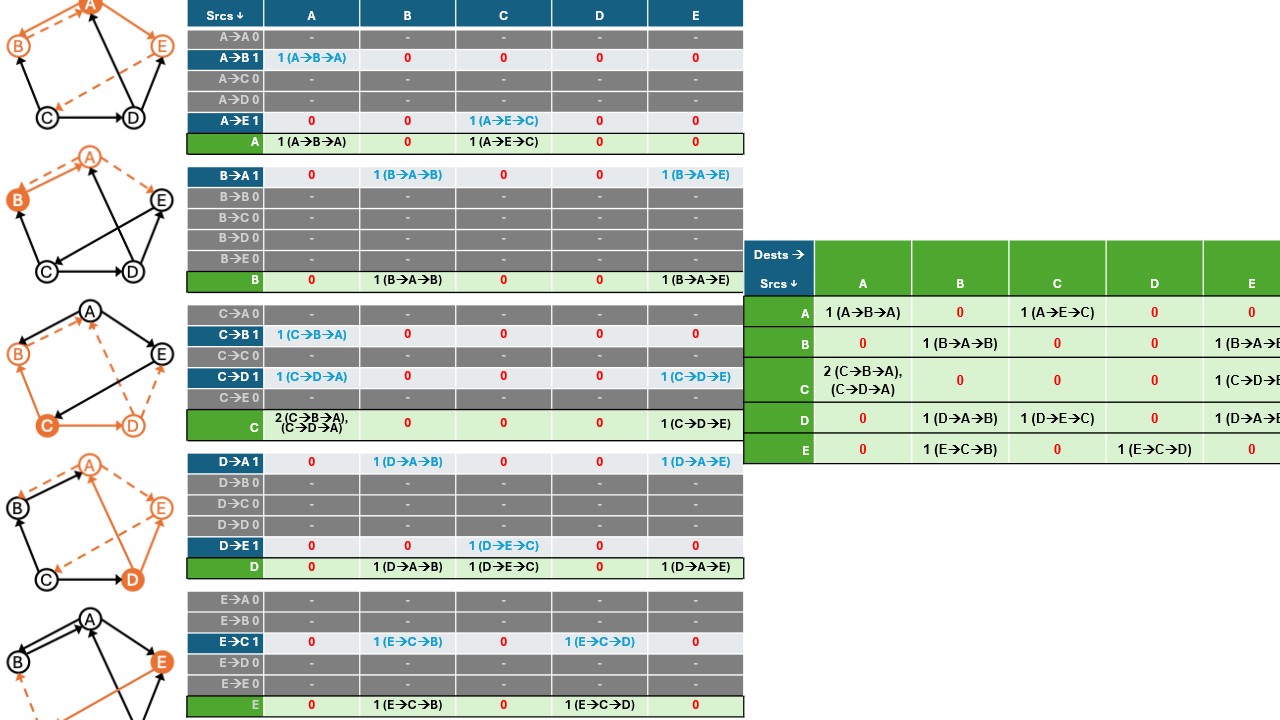
How is this Matrix Multiplication?
Let’s recall the basic process of matrix multiplication:
- Take a row from the first matrix.
- Take a column from the second matrix.
- Multiply matching elements and sum them up.
- The result is the product matrix.
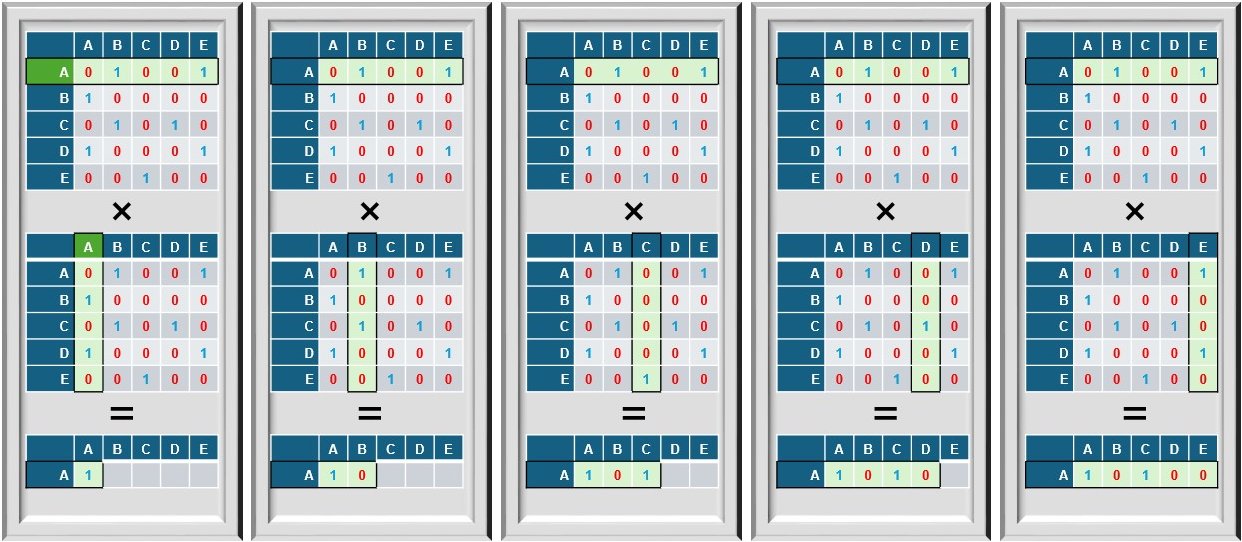
In school, we learned matrix multiplication more as a way to manipulate vectors when the space is transformed or to solve linear equations. But in graph theory, this is helping us compute multi-hop paths.
When applied to adjacency matrices:
- The row represents all nodes reachable in one step from a given (row) node.
- The column represents all nodes that can reach a given (column) node in one step.
- The multiplication and sum tell us how many length-two paths exist from the starting node to the destination node.
Matrix Exponentiation and Lateral Movement
By squaring the adjacency matrix, we expose all potential two-hop lateral movement paths. Repeating this process (raising the matrix to higher powers) shows longer paths. This method — simple matrix multiplication — helps us simulate how an attacker might traverse the network over multiple hops.
We have our model for Lateral Movement.
MITRE ATT&CK and Lateral Movement
MITRE ATT&CK framework
The MITRE ATT&CK framework is a curated knowledge base of how real-world attackers behave. It focuses on how adversaries interact with systems during different stages of an attack — and it’s built entirely on real observations from actual incidents.
Launched in 2013, ATT&CK was created to document the Tactics, Techniques, and Procedures (TTPs) used by advanced persistent threats.
Here’s how it breaks down:
- Tactics – the “why”: the adversary’s goal at a particular stage (e.g., persistence, lateral movement)
- Techniques – the “how”: the methods used to achieve that goal (e.g., remote login, credential dumping)
- Procedures – the “what”: real-world implementations of those techniques
This model helps us:
- Understand attacker behavior in depth
- Break down the attack lifecycle into actionable stages
- Focus on tactics and techniques that have been seen “in the wild”
- Speaks a common language when analyzing threats
Lateral Movement in MITRE ATT&CK
One of the key tactics in ATT&CK is Lateral Movement — where the adversary is trying to move through your environment.
This means jumping from one system to another to escalate access and get closer to their target. They don’t always need to exploit vulnerabilities; often, valid credentials and remote access tools are enough.
Why All TCP/IP Ports are Not Equal
ATT&CK calls out specific TCP/IP services/ports under lateral movement:
- RDP (3389)
- SSH (22)
- SMB (445)
- And others, including WinRM, VNC, and DCOM
These aren’t just any ports — they are interactive remote services that accept connections from other machines. If an attacker compromises a single set of valid credentials (thanks to a centralized identity service like Active Directory), they can access any machine across the network — just like a legitimate user.
That’s why it’s critical to understand which services (and ports) provide the key pathways for lateral movement — and should be the first focus of our microsegmentation strategy.
Excerpt from MITRE Lateral Movement “Remote Services” technique
| Remote Services | Adversaries may use Valid Accounts to log into a service that accepts remote connections, such as telnet, SSH, and VNC. The adversary may then perform actions as the logged-on user. |
| Remote Desktop Protocol | Adversaries may use Valid Accounts to log into a computer using the Remote Desktop Protocol (RDP). The adversary may then perform actions as the logged-on user. |
| SMB/Windows Admin Shares | Adversaries may use Valid Accounts to interact with a remote network share using Server Message Block (SMB). The adversary may then perform actions as the logged-on user. |
| Distributed Component Object Model | Adversaries may use Valid Accounts to interact with remote machines by taking advantage of Distributed Component Object Model (DCOM). The adversary may then perform actions as the logged-on user. |
| SSH | Adversaries may use Valid Accounts to log into remote machines using Secure Shell (SSH). The adversary may then perform actions as the logged-on user. |
| VNC | Adversaries may use Valid Accounts to remotely control machines using Virtual Network Computing (VNC). VNC is a platform-independent desktop sharing system that uses the RFB (“remote framebuffer”) protocol to enable users to remotely control another computer’s display by relaying the screen, mouse, and keyboard inputs over the network. |
| Windows Remote Management | Adversaries may use Valid Accounts to interact with remote systems using Windows Remote Management (WinRM). The adversary may then perform actions as the logged-on user. |
Modeling Lateral Movement with a Real-World Example
Legitimate enterprise tools — like software deployment systems or IT admin consoles — often rely on Remote Services to access machines across the network. Unfortunately, attackers use the same paths.
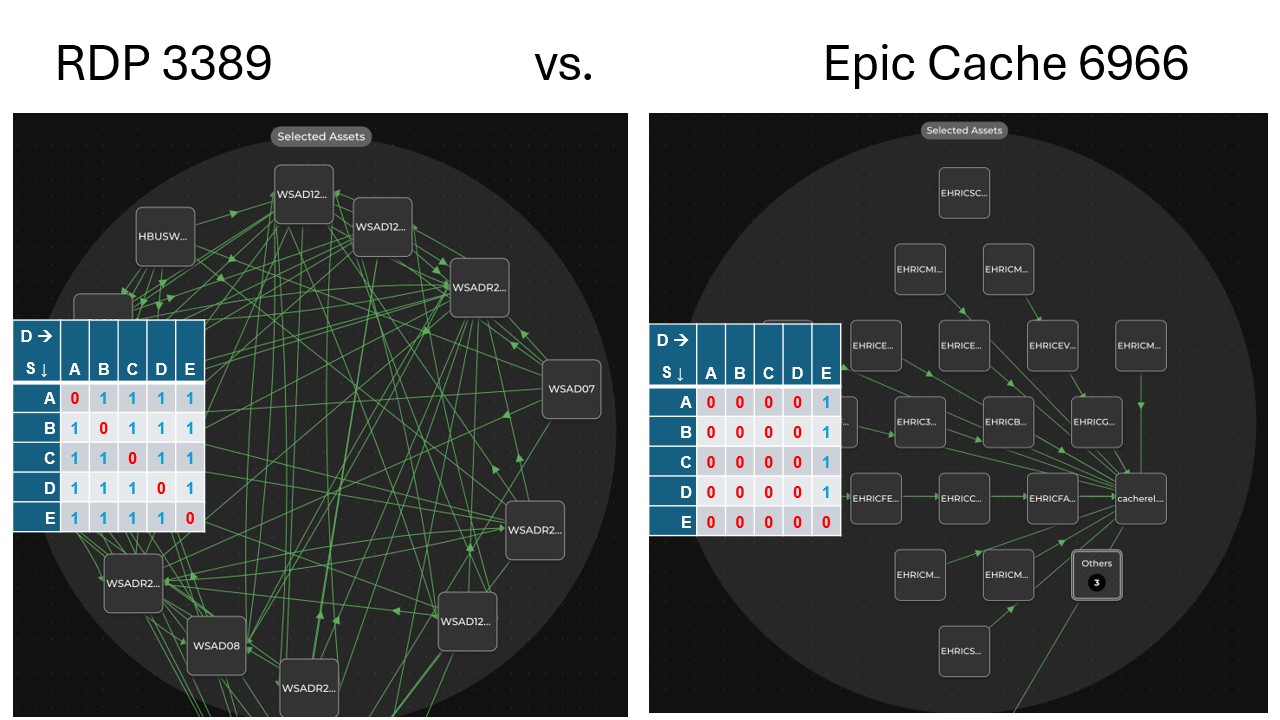
When we apply our lateral movement model to real network data, patterns quickly emerge.
For example:
- The adjacency matrix for RDP (port 3389) is almost completely filled (all 1s) — indicating that nearly every system can connect to every other system using RDP. That’s a wide-open lateral movement surface.
- In contrast, the matrix for Epic Cache (port 6966) is nearly empty (all 0s) — few systems accept connections on that port, making it much harder for an attacker to pivot.
This math-driven approach lets us quantify how exposed a port is to lateral movement — especially when modeling multi-hop paths across the network, which may not be as easy to spot visually. It moves us from guesswork to measurable insight.
Making Microsegmentation Effective
If the main purpose of microsegmentation is to stop the spread of breaches by limiting lateral movement, then modeling lateral movement is the most effective way to guide our segmentation strategy.
Using this approach, we can answer three critical questions:
- Which ports or traffic flows should we prioritize — and why?
(Focus on services like RDP or SSH that enable remote login across many systems.) - Is our current microsegmentation strategy actually working?
(Check whether the paths for lateral movement have been blocked or restricted.) - Have we segmented enough? Can we shift focus to other areas?
(Use the model to identify diminishing returns — and confidently move forward.)
Conclusion: From Pencil Puzzles to Microsegmentation
What started as a curious math puzzle — the challenge of tracing a path across the seven bridges of Königsberg — led Euler to invent graph theory, a simple yet profound branch of mathematics.
Centuries later, that same math gives us powerful tools to visualize and model lateral movement in our networks. By applying basic operations like matrix multiplication/ exponentiation, we can identify multi-hop attack paths and quantify lateral movement — not with guesswork, but with math.
This lets us turn microsegmentation from an abstract goal into a measurable, strategic defense. We can see what to prioritize, prove whether segmentation is working, and confidently stop the spread of breaches before they escalate.
From no-lift-pencil puzzles to real-world ransomware defense — simple math has the power to protect.
Want to see microsegmentation in action? Get a live demo here.
The post Euler’s Königsberg Bridges: How Simple Math Can Model Lateral Movement for Effective Microsegmentation appeared first on ColorTokens.
*** This is a Security Bloggers Network syndicated blog from ColorTokens authored by Satyam Tyagi. Read the original post at: https://colortokens.com/blogs/lateral-movement-microsegmentation-graph-theory/
