How to Monitor Athena Usage to Understand Your Operations, and Control Security and Costs
Introduction to our data lakes experience
Data lakes are great. They are flexible as they allow many object formats and multiple query engines. They are also cost effective – there is no need to manage or pay for resources like disks, cpu and memory. Data is simply stored in an object store and it is possible to use a managed query engine for a complete pay-per-usage solution.
We used our data lake for years and were happy with the cost. The cost grew from month to month and we were still happy – our data lake grew along with our usage.
As the cost continued to rise, we became less happy – mainly because we didn’t know why it was happening.
In this post we will explain how we analyzed AWS Athena and S3 Transfer costs to help us both understand exactly what we are paying for; and, of course, reduce our cost.
The audit trail enabled us to monitor usage by users and roles. The data we collected helped us to increase our security controls in the following ways:


- When we compared permission to actual data usage, we were able to revoke some permissions
- We found security misconfigurations like users / roles used by multiple applications
- We detected security incidents and data leakage events using anomaly detection
Read on to gain a better understanding of the problem and solution we chose. We include the technical details that will enable you to use our solution with your own AWS account.
An articulation of the problem
First, we wanted to know who did what in Athena. We found out learning this is not so simple and here’s why:
- Cloud trail management logs save the users, roles and queries
- Athena history saves the scanned data per query
We wanted to know the user, query and scanned data. To do it we had to join the two sources. In Athena the cost is calculated according to the scanned data. The scanned data is also an important indicator to the underlying S3 cost, which is determined by a combination of transfer, api calls and more.
We also wanted to perform analytics like:
- Profile users and services
- Find the heaviest queries according to data scanned
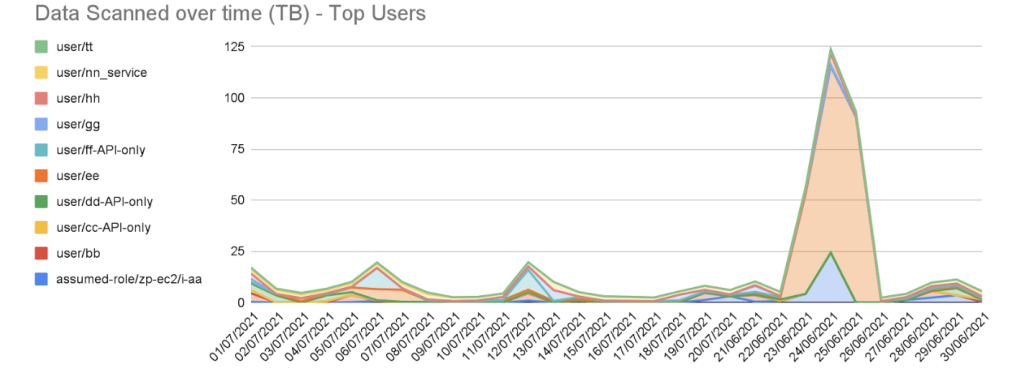
- Find usage over time, such as 30 days back or 90 days back
Not surprisingly – we decided to use Athena. Here is an example of our top users, according to data scanned, in the last 30 days:
To do such analytics we had to extract, transform and load data from cloud trail and Athena history into a table. Below you can find the technical details of how we did it.
The Solution
Flow
We created a Python-based Lambda function which inserts daily data into the data lake. Here are the two main steps performed by the function:
- Read Athena history data through boto3 API and write objects to S3
- Join the Athena history and Cloud Trail management logs and write the results to S3
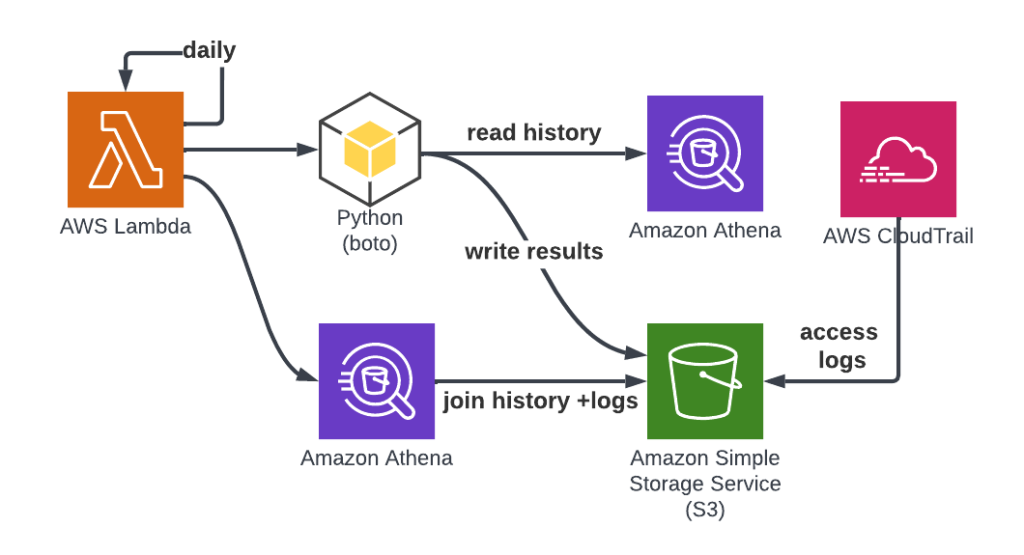
Once the data is written to S3 you can query and analyze it using Athena. See the examples below.
Technical details
Athena History Table
The Athena history table is needed for the ETL (Extract Transform Load) process to work. The history data contains data about the query like the data scanned in bytes that we will use. It is possible to keep the data, or delete it after the ETL run. The history is available through the API going back 45 days.
Here is an SQL statement for creating the table:
CREATE EXTERNAL TABLE athena_history(
 query_id string,
 data_scanned bigint)
PARTITIONED BY (
 day string)
ROW FORMAT DELIMITED
 FIELDS TERMINATED BY ','
STORED AS INPUTFORMAT
 'org.apache.hadoop.mapred.TextInputFormat'
OUTPUTFORMAT
'org.apache.hadoop.hive.ql.io.HiveIgnoreKeyTextOutputFormat'
LOCATION
 's3://my-bucket/athena_history'
Use the Python function below to create the data for the table. The function gets a day and a workgroup and writes the data to a CSV file:
def create_workgroup_history(day: str, workgroup: str) -> str:
   file_name = f"{workgroup}_queries.csv"
   with open(, "w") as csv_file:
       athena = boto3.client("athena")
       paginator = athena.get_paginator("list_query_executions").paginate(WorkGroup=workgroup)
       writer = csv.writer(csv_file)
       for page in paginator:
           query_executions = athena.batch_get_query_execution(QueryExecutionIds=page["QueryExecutionIds"])
           for query in query_executions["QueryExecutions"]:
               if "CompletionDateTime" not in query["Status"]:
                   continue
               query_day = query["Status"]["CompletionDateTime"].strftime("%Y-%m-%d")
               if day == query_day:
                   writer.writerow([query["QueryExecutionId"], query["Statistics"]["DataScannedInBytes"]])
               elif query_day < day:
                   return file_name
We use a similar function in our Lambda function, which later gzips all the workgroups’ files and uploads them to a new partition (folder) in the history table in S3.
Cloud Trail Management Logs Table
Cloud trail collects the users/roles and queries done by Athena as part of its management logs. If you don’t have a trail configured you will have to define one.
You have to create an external table for reading your cloud trail logs by Athena. Follow the instructions here to do it.
Athena Events Table
The events table will hold the joined data. We will have to create a table for the results. We chose the subset of cloud trail fields which interest us the most – you can use your own set of fields and change the table accordingly.
Here is the SQL statement for creating the table:
CREATE EXTERNAL TABLE athena_events (
 event_time timestamp,
 user_identity_type string,
 user_identity_principal string,
 user_identity_arn string,
 source_ip string,
 user_agent string,
 query string,
 `database` string,
 data_scanned bigint)
PARTITIONED BY (
 day string)
ROW FORMAT SERDE
'org.apache.hadoop.hive.ql.io.parquet.serde.ParquetHiveSerDe'
STORED AS INPUTFORMAT
'org.apache.hadoop.hive.ql.io.parquet.MapredParquetInputFormat'
OUTPUTFORMAT
'org.apache.hadoop.hive.ql.io.parquet.MapredParquetOutputFormat'
LOCATION
 's3://{TARGET_BUCKET}/{TARGET_FOLDER}'
)
We have two source tables, one for the scanned data and one for the events – we will join the data, and insert the results to a new table. Both tables should have the daily partition before you can query them.
Here is an SQL statement example that adds the partition if necessary.
ALTER TABLE athena_history ADD IF NOT EXISTS PARTITION (day = '2021-07-01')
ALTER TABLE {cloud_trail_table} ADD IF NOT EXISTS
PARTITION (region= 'us-east-1', year= '2021', month= '07', day= '01')
LOCATION 's3://{SOURCE_BUCKET}/{SOURCE_FOLDER}/CloudTrail/us-east-1/2021/07/01/'
We use boto3 Athena API to run those queries from the Lambda code.
Joining Athena History with Cloud Trail
The last step of the ETL job is used to join and insert the results. We used an insert into command which does the following operations:
- Joins the data
- Converts it to parquet format for better performance and costs
- Writes the data to the right S3 location
- Alters the target table
Here is the SQL statement we used:
Alter the tables before running the daily command:
INSERT INTO athena_events
SELECT
 CAST(From_iso8601_timestamp(eventtime) AS TIMESTAMP) AS event_time,
 useridentity.type AS user_identity_type,
 useridentity.principalid AS user_identity_principal,
 useridentity.arn AS user_identity_arn,
 useragent AS user_agent,
 sourceipaddress AS source_ip,
 json_extract_scalar(requestParameters, '$.queryString') AS query,
 json_extract_scalar(requestParameters, '$.queryExecutionContext.database') AS database,
 data_scanned,
 athena_history.day AS day
FROM {cloud_trail_table}
INNER JOIN athena_history ON json_extract_scalar(responseelements, '$.queryExecutionId') = query_id
                                         AND athena_history.day = '2021-07-01'
WHERE eventsource = 'athena.amazonaws.com'
     AND eventname IN ('StartQueryExecution')
     AND region = 'us-east-1'
     AND year = '2021'
     AND month = '07'
     AND {cloud_trail_table}.day = '01'
When the statement is done the data in the table is ready to be queried.
Analytics Examples
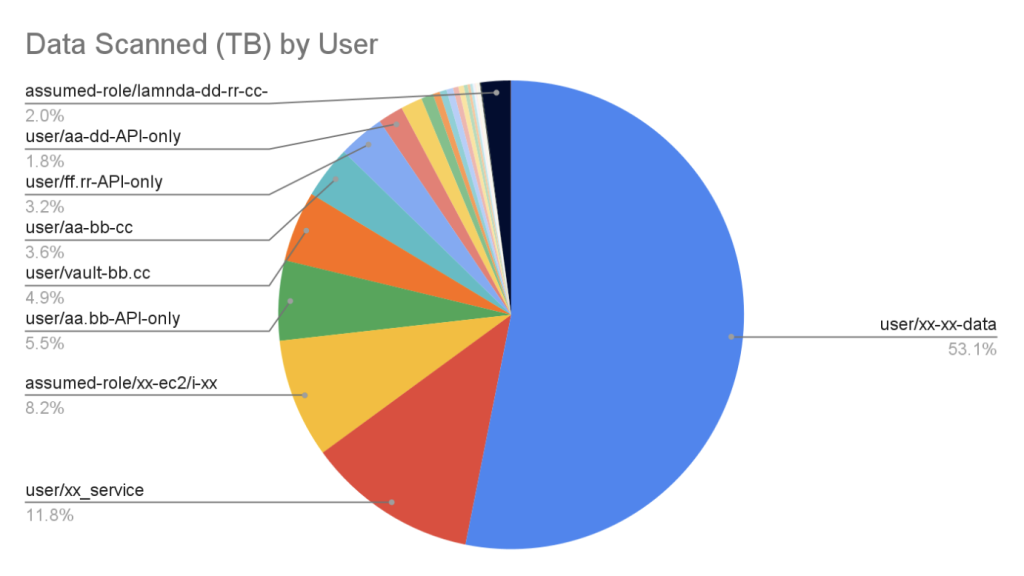
Once your events table is ready you can query it by Athena. Here is an example SQL for finding the top users by data scanned:
SELECT user_identity_arn,
      ROUND(SUM(data_scanned) / 1000000000000.0, 2) AS data_scanned_tb
FROM athena_events
WHERE DATE(day) >= DATE_ADD('day', -30, CURRENT_DATE)
GROUP BY user_identity_arn
ORDER BY data_scanned_gb DESC
LIMIT 10
Here is a visualization of the results:
Takeaway conclusion
Monitoring your data lake usage continuously will help you to understand your operation, and control your security and costs.
You can get to a better permissions model by monitoring the actual usage of the data by your users and roles. You can also detect anomalies – which can lead you to find security incidents. Athena is one of many services that you have to monitor, and the more services you cover, the better control you have.
The post How to Monitor Athena Usage to Understand Your Operations, and Control Security and Costs appeared first on Blog.
*** This is a Security Bloggers Network syndicated blog from Blog authored by Ori Nakar. Read the original post at: https://www.imperva.com/blog/how-to-monitor-athena-usage-to-understand-your-operations-and-control-security-and-costs/