

Catching True Positives in Network Security
LogRhythm’s Analytic Co-Pilot team works with customers to get the most value from their cybersecurity investment; we spend time reducing and removing the false positive alarms within their environment through investigating, tuning the rules, and checking the outputs.
Sometimes rules can be tuned too much where true positives are not alerted upon and can be missed. Read this blog post to learn how to perfect your rules and properly trigger alarms. We’ll guide you through
- The differences between true and false positives
- Ways to test and ensure that rules are working as desired
- How to tune rules and build confidence in your SIEM
- Additional tools and resources to improve your tuning efforts
What is a True Positive vs. a False Positive
When looking at rules and use cases, use the table below to decide what is a true positive and a false positive in network security.
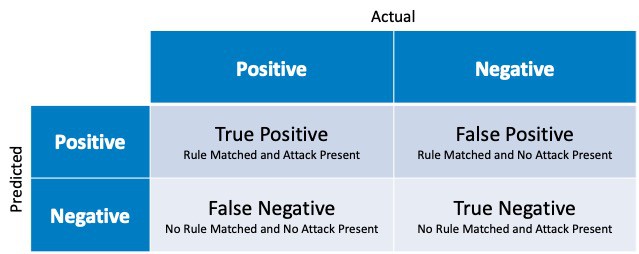
Figure 1: Chart explaining the different outcomes of use cases vs the expected outcomes.
- A true positive is where a rule is configured and logs match that rule for a real threat. This means the rule worked as intended and alarmed correctly.
- A false positive is where a rule is configured and the log matches the rule, however the logs that matched are not considered a threat and should be ignored.
True Positive and False Positive Examples
Seeing “Log Cleared” on a system is a good example for true versus false positives. The rule initially configured triggers when a log with the Common Event of “Log Cleared” matches; indicating that someone has cleared the Windows Event log.
A true positive for this example would be if a user, such as joe.bloggs, clears the event logs and the alarm is triggered. However, a false positive example would be when the “system” account has cleared the event log, which is expected when Windows Event Service rotates a Windows event log when it is cleared. Therefore, this would be tuned to remove the false positive. However, if this were to be tuned further and add other accounts into the exclusion, such as “Domain Admins” and one of those accounts were compromised and cleared their tracks, then the alarm would not fire and become a true negative, when it should be triggering the rule and be a true positive.
Tuning and Testing Rules with SIEM
Now let’s discuss how to test and ensure that your rules are working as desired to help build confidence in your SIEM solution.
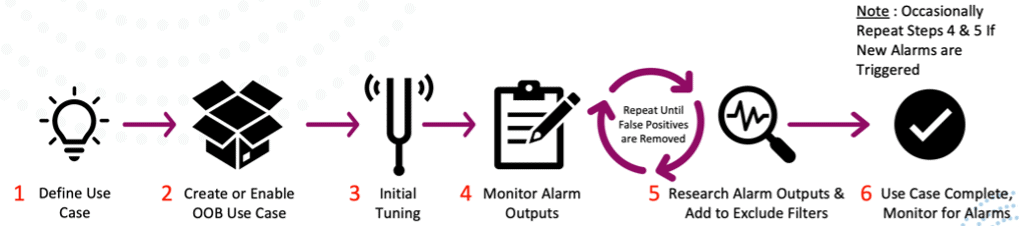
Figure 2: Process of tuning rules to trigger security alarms and create use cases.
Where to Test
Understanding how a log progresses through the SIEM and what can happen at each stage can assist with testing and troubleshooting use case tuning. Below I will discuss what can impact different stages of the process and things to look out for when managing the system.
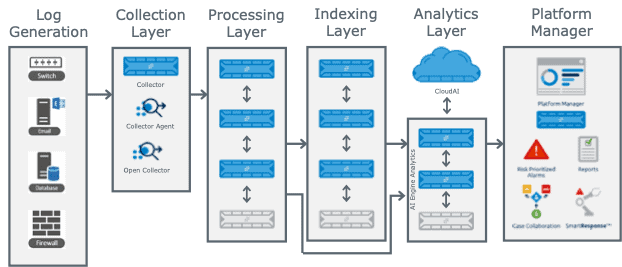
Figure 3: How a log progresses through the NextGen SIEM Platform.
Log Generation Layer
This is where the log is generated and is the only step that sits outside of the LogRhythm SIEM. If the log is not generated in the first place, then LogRhythm cannot collect it and cannot trigger your use cases. Checking that logs are generated at the initial onboarding of the log source is important, but also checking for changes after that time is also critical. Here are some questions to guide you through the process:
- Are all servers and endpoints being collected? (e.g., has there been any new servers added to the environment which are not being collected?)
- Are all log sources for the systems being collected? (e.g., alongside Windows Application, System and Security logs, are things like PowerShell, IIS, DNS, other application logs being collected?)
- Are the group policy and audit policies enforced across all organizational units (OUs) in your active directory? (e.g., do you have servers in OUs which contain different GPOs and configurations to other systems? What about non-domain joined systems?)
- Do firewalls have the right configuration? (e.g., do you need to ensure that all firewall rules have logging enabled to get logs. Are all components within a NGFW configured to send logs?)
Collection Layer
The collection layer is where the LogRhythm SysMon/Collector Agent collects the logs from your devices and delivers them to the next layer. This can also include Open Collector and Cloud Collector for LogRhythm Cloud customers. The important point for this layer is to ensure that logs are collected in a timely fashion and sent to the data processors as soon as possible after the log has been generated and available to be collected. Here are some things to keep in mind:
- Logs being collected on time is the main focus and can be monitored from the “Last Log Message” column in the Log Sources tab of the Deployment Manager.
- For Flat Files, is the date and time configuration set correctly?
- Virtual Log Sources can assist with tuning and filtering logs at the agent level, however, can lead to important logs being discarded if the Regular Expression is not precise enough.
- Agent to Data Processor configuration parameter tuning can impact how quickly logs are sent. The key properties of the agent to configure are “Flush Batch” (how many logs are sent at a time) and the “Compression” (how much compression is used to shrink the logs being sent). The Agent sends logs in batches and will wait until the previous batch has been received and confirmed before sending the next batch. If the batch is larger that means more logs are sent at the same time and a higher compression means that the time it takes to send each batch is reduced as the number of bytes will be considerably smaller. Unless for bandwidth sensitive links, I wouldn’t suggest a Compression level of above 5, due to negligible bandwidth saved versus CPU cost of compressing the logs.
- Over Subscription can impact the performance of any collector; if it is receiving too many syslog messages or trying to collect too many Windows Event Logs/Flat Files, then the collection will fall behind if resources are not available to the Agent Service.
- Permissions for Log Collection or network connectivity can impact the collection layer. If the service account no longer has permission to read the logs, or the ports are not open on the firewalls, then this will impact log collection.
Processing Layer
The Data Processors are the heart of this layer and process each log that is sent from the Agents. This layer is important to get the meta data fields parsed out and stored, where the later layers can use for use cases and searching. There are some key areas to understand here:
- Regular Expressions (RegEx) are written well (with speed and efficiency in mind) and quickly match the logs.
- Data is being parsed with the RegEx into the correct meta data fields and the right Common Events are being assigned to the logs.
- No RegEx is timing out (100ms allowance by default), meaning that the RegEx performs well and speedily. If a log times out but would have matched, then that log may only hit the Catch All and not be properly classified.
- Sub Rules within MPE Base Rules are correctly categorizing the logs to Common Events.
- Base Rules are correctly sorted within the Rule Manager. Once a log matches a RegEx pattern, it will stop processing. Therefore, it is important to ensure that the rules are ordered correctly to ensure that more specific RegEx is before more generic rules which will also match.
- Log Processing Policies decide which RegEx rules to enable and should ensure that all the required rules are correctly enabled in the processing policies.
- Global Log Processing Rules sit after the RegEx engine and can override some of the decisions made, such as if the logs should be indexed or sent to AI Engine, this can impact the log availability to a use case and cause the rules not to trigger.
Indexing Layer
Although this may not be in the critical path for logs to be generated, processed, and sent to AI Engine, this can be important for gathering logs which have triggered the alarm (otherwise you would not be able to drill down into Alarms triggered).
Analytics Layer
Being the main point of configuration for use cases, this is where most of the tuning and troubleshooting happens for reducing false positives. However, this can also be the place where rules are over tuned and true positives are not detected. This could be from adding extra Group Bys, changing the rule logic, log source criteria configuration, lists being changed that are used for a rule, as well as other configuration options.
Platform Manager
As the brains of the deployment, the Platform Manager contains several databases, including the Events and Alarms databases. If these databases are not sized correctly, then it could cause delays when inserting Events or Alarms, meaning that they would not be available on the Web Console, Client Console, or alarm notifications from triggering. This also contains the storage space for the Case Management function of the Web Console which may be relied on for incident management.
Approaches to Testing
There are three categories of testing that are discussed here:
- Test server and/or environment
- LogRhythm ECHO
- Simulated attack vendors
Test Server and/or Environment
Setting up a test environment allows for full end-to-end testing of use cases and how logs will appear in your LogRhythm SIEM. Having an environment (that could be as small as a single server) to test use cases on, really shows that everything is working from Log Generation to the use case parameters and platform health. By having the environment as part of your existing Active Directory and in the same OUs as other systems, you know that it is set up and configured the same as production systems. Growing your test environment can include adding test systems in separate OUs, as well as different logical areas of the organization (e.g., DMZ, end-user environment, cloud).
Once you have the test environment set up and onboarded to the SIEM as you normally would (collecting the same logs, via the same methods), then it’s time to look at testing frameworks. Some of the use cases you want to test could be very easy to replicate in a test environment; for example, a Service Account Interactive Logon can easily be tested by logging in as a service account and checking for the alert. However, with some other use cases it may be better to use existing frameworks. Some of these include Red Canary Atomics and Caldera. Both of these are based on MITRE ATT&CK framework and provide scripts or even PowerShell modules to execute tests for MITRE techniques. These are typically non-destructive and contain the way to clean up after the technique has been executed. Along with this, building your own test scripts or guides can be used to evaluate more specific use cases for your environment. For example, you can take previous incidents and learn how they were executed and create test scripts based on the findings.
There should be a cycle to using the test environment:
- Test attack method
- Review SIEM outputs
- Troubleshoot/tune/create use cases
- Retest and repeat until desired output at step 2
Although this does require extra resources, licenses, and time to maintain, it does provide the most comprehensive end-to-end testing available, and will help understand not just the use case, but how the attack is executed.
LogRhythm ECHO
LogRhythm Echo allows you to replay logs through the SIEM from a library of use cases that either comes with the tool or that you provide.
The ECHO tool allows for logs to be fed back through the SIEM and bypass the log generation and collection layer and insert the logs just at the Processing layer. This means it will test how LogRhythm is working from the point of processing the logs to alarms being generated or dashboards being populated. This is good for checking the following:
- MPE rule updates from the Knowledge Base updates
- AI Engine rule changes
- Data Processor queuing or processing time
- Misconfiguration of SMTP, SmartResponse™, or other system configurations
This approach is great for quicker testing of use cases with known logs that have been extracted from previous incidents or testing. These can be scheduled within ECHO to test on a frequent basis too, allowing for automation within the environment.
As ECHO can also send multiple logs into the system, it is great for testing use cases for harder to test scenarios; for example, with brute force or multiple lockouts, this would allow you to change one log to come from different IP addresses and send logs to trigger these rules.
Simulated Attack Vendors
Many different vendors exist that can provide automated tools to simulate attack methods in your environment, including Cymulate, AttackIQ, CyCognito. These typically will install agents into your environment and allow for attacks to be triggered from inside your network. These can also add the benefit of integrating with other products you may have and can provide further recommendations. However, these would also mean another system to manage and costs for the product.
Penetration testing and internal team exercises can also fit into this category, where you have a team trying to attack a network as a flow, rather than just testing discreet techniques.
As with the diagram below, you can see the red team, blue team, and purple team are typically where the SIEM administrators and testers are focused on.
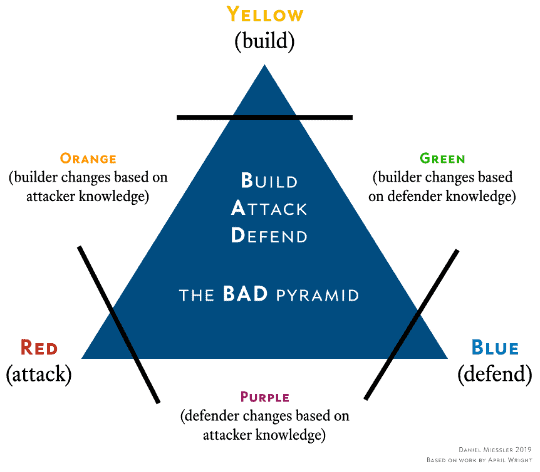
Figure 4: The Build, Attack, Defend (BAD) Pyramid.
This provides a more real approach to testing, where you may find approaches that wouldn’t be listed in the resources mentioned earlier or something that is more specific to your environment.
Using the output of these methods with LogRhythm ECHO can provide a great combination to ensure that any rules created will work against these existing known logs for the attack method.
Depth of Approaches
From the different approaches we have looked at, this shows where they typically test within your LogRhythm environment.
As you can see the test environment is end-to-end all the way up to ECHO which is only testing the LogRhythm environment.
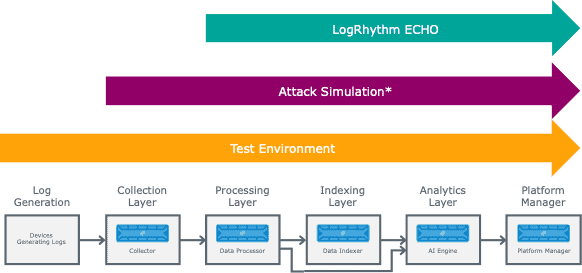
Figure 4: Depths of Testing the LogRhythm Environment.
Attack simulation is typically from collection layer, but some of the red team/penetration testing could extend to the Log Generation layer, depending on where and how those techniques are performed.
Best Approach for Catching True Positives
There is never going to be one approach to fit all in testing. If you are a one-person team with no extra resources versus a security operations center (SOC) of dedicated SIEM engineers focussed on testing, you will have different priorities. However, I believe that the best approach to finding true positives is a mix and match approach.
Using each of the approaches at different intervals will provide great coverage and use resources effectively. Having a test environment where you can run scripts and test logging creation is super helpful and you can use an environment to create rules and tune them later down the line.
It can also be very resourceful to build a set of use cases in ECHO which can run on a weekly basis for a quick check of the system. For example, you can set up ten use cases to run on a Monday morning and then expect ten alarms to be triggered, proving that the SIEM is working as it should. This will help you tune alarm parameters and check that you haven’t tuned them too much. If you take steps to trigger the same ECHO use case and wait for the alarm to trigger, this will help you know that the true positive works. On a quarterly or yearly cadence, running a red team exercise or external penetration test can provide more insight to attack vectors and new approaches to build rules against.
The post Catching True Positives in Network Security appeared first on LogRhythm.
*** This is a Security Bloggers Network syndicated blog from LogRhythm authored by Kelsey Gast. Read the original post at: https://logrhythm.com/blog/catching-true-positives-cybersecurity/
