

An Optimisation Story: Building a Code Scanner for Large Golang Apps
This post will shed some light on how we were able to optimise one of our frontends, reducing the typical project’s run time by half. We’ll also take a look at some of the pitfalls we encountered and how we can apply our changes to other projects as well.
Background
We’re maintaining multiple frontends for converting source code and binary applications into their corresponding CPG representation. One frontend in particular, called go2cpg for converting Go source code, was found to be somewhat slower than expected on certain bigger repositories.
What we did
Since we generally have to test language frontends on publicly available code, we’re describing here all the steps based on the open-policy-agent/opa repository, which is big enough, that even on a beefy machine the conversion will take a few seconds (in this case, all numbers reported below from an 8 core / 16 thread CPU, with 64 GB RAM available and a fairly fast M.2 NVMe SSD.
The initial state was this: Running the go2cpg generate command (which you'll generally not see like this, it's wrapped in our command line tool when you invoke it with sl analyze –go …) wasn't as quick as we'd have hoped:
go2cpg generate ./...

41.47s user 1.20s system 270% cpu 15.774 total
41.69s user 1.06s system 277% cpu 15.405 total
41.86s user 1.20s system 271% cpu 15.884 total
42.07s user 1.16s system 271% cpu 15.910 total
42.11s user 1.15s system 273% cpu 15.805 total

avg. 41.84s user 15.756s total
These measurements were taken by hand for illustration purposes, but for benchmarking we’ve adopted hyperfine, which in our case was then invoked like this:
hyperfine --warmup 3 "go2cpg generate -o /tmp/cpg.bin.zip ./..."
Note here we’re adding a few warm-up runs to reduce any chances of disk caching or perhaps even some operations of the Go toolchain interfering with measurements. The /tmp directory was also set to a RAM disk – unfortunately /dev/null can't be used because of how the ZIP archive gets written.
Our baseline was therefore round about sixteen seconds total.
Because we had already investigated this topic earlier, it was clear there were still a few areas to investigate, in particular further reducing the impact of compression and Protobuf generation.
However, as a first step we’ve started to produce and drill into CPU and memory profiles.
Profiling
In Go, profiling is already extremely well supported by the standard library, using the runtime/pprof and net/http/pprof packages. The first allows us to generate the profiles, the second one to provide a nice web interface to analyse the results once they've been generated.
We’re always compiling these in as to allow customers to generate and then send the profiling data to us:
SHIFTLEFT_CPUPROFILE=cpu \
  SHIFTLEFT_MEMPROFILE=mem go2cpg generate ...
We end up with two files, cpu and mem and can then look at them using:
go tool pprof -http=":8000" \
  <path to go2cpg binary> cpu # respectively "mem"
The overall steps are:
- loading Go source code
- type checking it
- generating Protobuf chunks (both for the AST and the CFG Control Flow Graph)
- marshalling those to raw bytes
- writing them into a ZIP archive
These are partially also happening concurrently, though we still expect to find some clusters according to these functional parts.
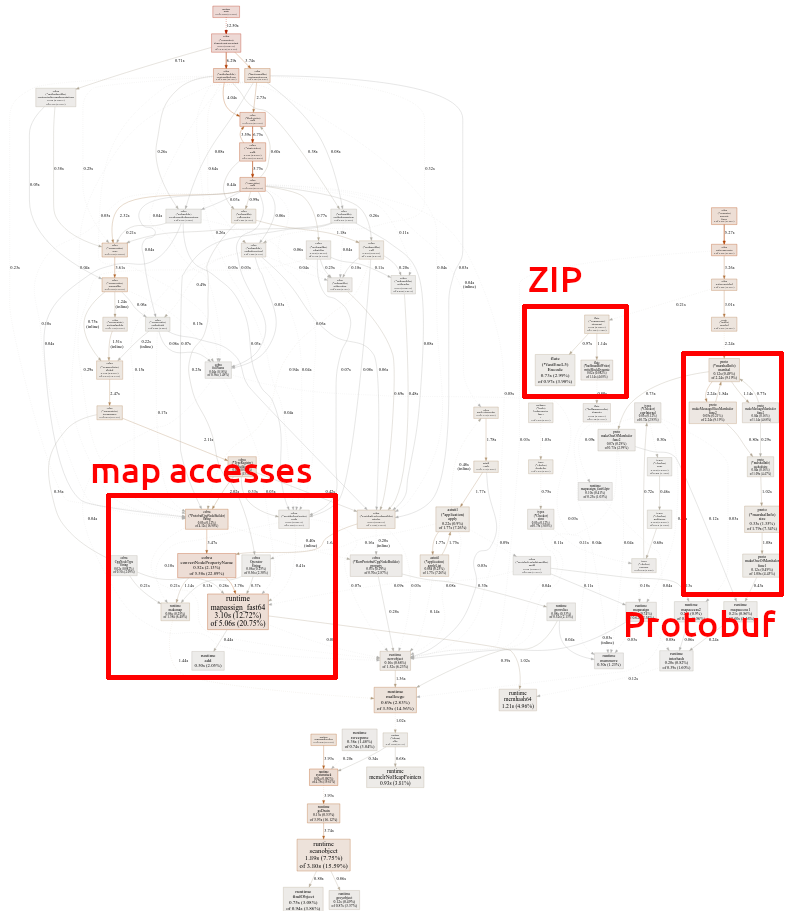
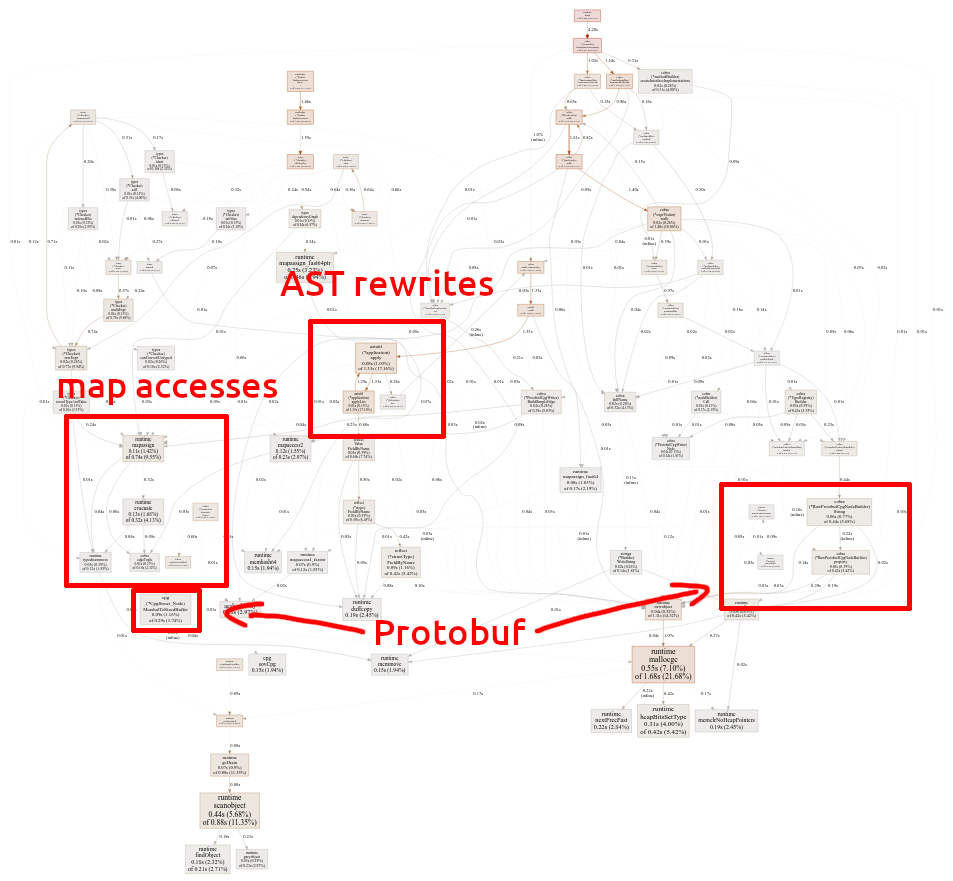
By a huge margin the performance is actually dominated by the type checker phase of the Go toolchain, which we’re relying on internally to analyse Go code.
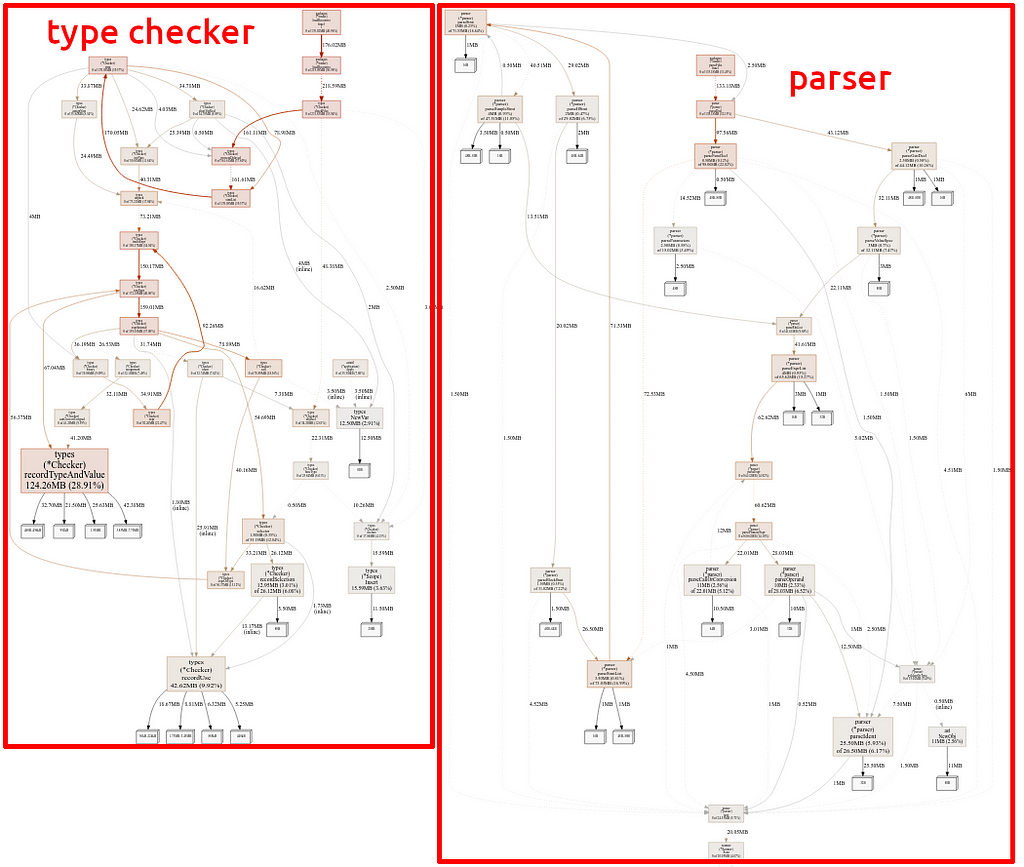
The memory view isn’t actually terribly interesting, we see that the type checking and parsing dominates allocations by a huge margin.
Apart from that, it actually turned out there were a few more pieces of the puzzle.
We can see, that one area, the ZIP compression, takes up quite some time.
We can also identity another area for the Protobuf marshalling taking up some significant amount of time.
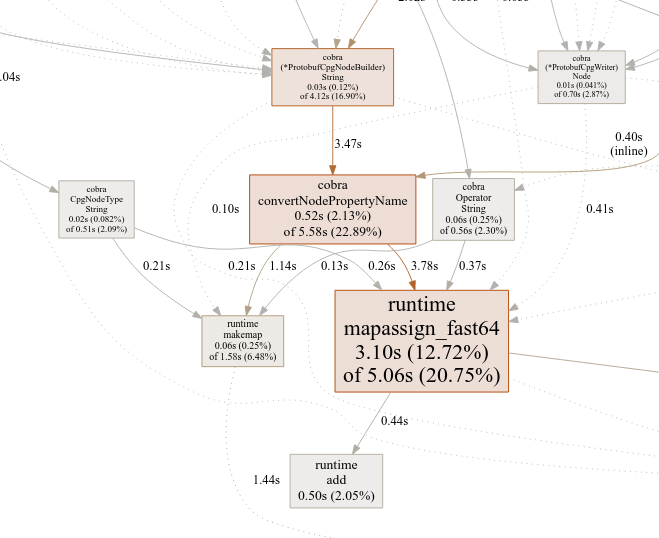
Lastly we can see that some map accesses take a huge amount of time. This was a curious finding as we’ll explain later.
Non-obvious cost of maps
We had a certain pattern for enumerations, which turned out to be rather much more costly than expected: Initially we had defined operators and a couple of other enumerations with an int-based type and constants defined via iota:
type Operator int
const (
    AssignmentOperator Operator = iota
    AssignmentPlusOperator
    AssignmentMinusOperator
    // ...
)
Since we also needed string values for marshalling, we had the following method defined for it:
func (o Operator) String() string {
    s, ok := map[Operator]string{
        AssignmentOperator:      "<operator>.assignment",
        AssignmentPlusOperator:  "<operator>.assignmentPlus",
        AssignmentMinusOperator: "<operator>.assignmentMinus",
        // ...
    }[o]
    if !ok {
        panic(fmt.Sprintf("unknown operator %d", o))
    }
    return s
}
This method was then called in many places and as it turns out, in the profiling data this showed up prominently, as the dictionary access was extremely costly.
Luckily changing this pattern required not that much work, most of which was mechanically changing the definitions and call sites in some places to also get rid of the superfluous String method call instead of a simple string cast:
type Operator string
var AssignmentMinusOperator Operator = "<operator>.assignmentMinus"
var AssignmentMultiplicationOperator Operator = "<operator>.assignmentMultiplication"
var AssignmentDivisionOperator Operator = "<operator>.assignmentDivision"
// ...
In cases where we need multiple associated values, we also simply changed the definitions from int to a struct { int; string } etc. and instead defined global variables (which of course should be treated as the constants they really are).
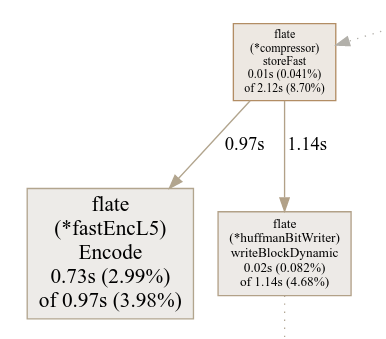
Compression Levels
The Go frontend has to produce output at least in an internal exchange format for CPGs, essentially a ZIP container of binary Protobuf blobs.
We were using the standard library ZIP routines before, however replacing them with an optimised implementation from klauspost/compress allowed us to save some time and also switch off compression completely:
envMethod := os.Getenv("SHIFTLEFT_COMPRESSION_METHOD")
compressionMethod, err := strconv.ParseUint(envMethod, 10, 16)
if err != nil {
    compressionMethod = uint64(zip.Deflate)
}
g.flagCompressionMethod = cmd.Flags().Uint16(
	"compression-method",
	uint16(compressionMethod),
	"Specifies the compression level for ZIP archive output"
)

// ...

w, err := archive.CreateHeader(&zip.FileHeader{
    Name:   entry.Name,
    Method: compressionMethod,
})
Since this is a mostly internal flag (we wouldn’t normally require customers to think about this at all), we didn’t bother with more features around it. Essentially there’s just two levels (compared to the standard zip utility on Linux for example), 0 for no compression and 8 for medium Deflate compression.
It’s noteworthy of course that we’re trading a decrease in running time with an opposite increase in disk space consumption. In our example we’re going from a 20 MB ZIP file to a 80 MB one. In all likeness this is not going to be a problem though (we’re only ever unpacking these files once, or maybe a handful of times) and therefore this flag might well be enabled globally soon.
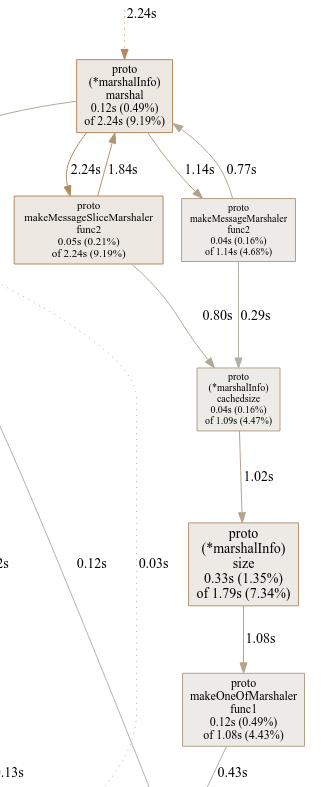
Protobuf Marshalling
Most of the I/O time is being spent on generating Protobuf structures, marshalling them into raw bytes and then writing them out.
Unfortunately the standard Protobuf package is using reflection, a bad sign if you want to generate megabytes of it.
Fortunately there’s at least one improved fork called gogo/protobuf, which allows us to use code generation for all relevant structures. This change boiled down to replacing part of the protoc call that generates the Go code from our CPG schema and then taking the new version of that code. We actually only need the marshalling routines, unmarshalling isn't relevant here and we could reduce the amount of generated code – a minor optimisation though.
Apart from this change, actually using the library is as easy as including another dependency:
import (
    // ...
    _ "github.com/gogo/protobuf/proto"
    // ...
)
This change also exposed a small bug in either the interface contract, or our code: It turned out that all generated Protobuf chunks were sharing some of the previously generated chunks when using the newly generated code:
func writeToProtobuf(w io.Writer,
                     cpg *cpg.CpgStruct,
                     pbuf *proto.Buffer) error {
    err := pbuf.Marshal(cpg)
    if err != nil {
        return err
    }
    _, err = w.Write(pbuf.Bytes())
    pbuf.Reset()
    return err
}
This function is reusing a proto.Buffer instance and was working fine with the standard Protobuf library. For the gogo/protobuf code we had to change this to:
func writeToProtobuf(w io.Writer,
                     cpg *cpg.CpgStruct,
                     buf []byte) error {
    size := cpg.Size()
    if cap(buf) < size {
        newSize := cap(buf)
        for newSize < size {
            newSize *= 2
        }
        buf = make([]byte, newSize)
    }
    n, err := cpg.MarshalToSizedBuffer(buf[:size])
    if err != nil {
        return err
    }
    _, err = w.Write(buf[:n])
    return err
}
Without focusing too much on the perhaps not quite optimal size calculation, the essential bit here is reusing a raw byte slice instead of the predefined buffer.
Minor Fixes
We’ve also changed some of the string concatenations to use strings.Builder, largely a mechanical change that the compiler really should perform for us, as it's done in Java. This change will not make the biggest impact unless it's in a very hot code path (as it is for us). Also passing through this builder instance will speed up things instead of simply returning strings from the String method and then adding those results to yet another builder. We really want to have a stream-like output here, always adding to the same builder instance in all possibly recursive function calls and only at the end taking out the generated string.
Apropos caching, we’re now also taking a handful of the most often generated structs and store them in a few variables. Thankfully the marshalling code only takes these elements and appends them to the output buffer, never modifying them. This is essential to us being able to share these objects in memory and with ~500k calls to the most often used object down to 60k for the least-often-used cached object we’re removing quite a few allocations essentially for free. The only cost here is checking one enumeration and one string value for equality — here the trade-off still makes sense:
func initBuilders() {
	intValues = make([]cpg.PropertyValue, maxIntValues)
	for i := int32(0); i < maxIntValues; i++ {
		intValues[i] = cpg.PropertyValue{
			Value: &cpg.PropertyValue_IntValue{
				IntValue: i,
			},
		}
	}
	value := &cpg.PropertyValue{
		Value: &cpg.PropertyValue_StringValue{
			StringValue: NamespaceBlockNode.Name,
		},
	}
	astParentTypeNamespaceBlock = &cpg.CpgStruct_Node_Property{
		Name: cpg.NodePropertyName_AST_PARENT_TYPE,
		Value: value,
	}
	// ...
}
This also shows how we’re caching a few of the most often-used integer values (e.g. similar to how, say, Python caches small integers).
The distribution of the elements here seems to follow a power law curve, so taking only the first few elements will have the most impact (these are the tuples of “key” and “value” with their corresponding usage count for the analysed repository):
// AST_PARENT_TYPE/NAMESPACE_BLOCK 458373
// AST_PARENT_FULL_NAME/<global> 319088
// DISPATCH_TYPE/STATIC_DISPATCH 122132
// SIGNATURE/ 103669
// TYPE_FULL_NAME/void 62816
// we're caching the top five elements only
// for illustration, these are the next five elements in order:
// CODE/ 38819
// NAME/bool 36581
// FULL_NAME/bool 36552
// NAME/<operator>.assignment 33922
// METHOD_FULL_NAME/<operator>.assignment 33921
Some other values could also be made into global variables, effectively constants though, e.g. constant.MakeUnknown at least at the time of writing always returns the same empty struct – since all operations on it don't care about identity we're free to only make this call once and reuse the result.
We had a few places where we used a Builder pattern to create objects. This is very nice for readability and the ability to reuse the builders, but it also adds overhead for no reason in some places. Thus we were able to inline certain calls manually, e.g. something like w.ComplexEdge(_type, src, dst).Build() would before allocate a new builder object in ComplexEdge and immediately throw it away in the Build method. Observing that we didn't even use the functionality otherwise offered by ComplexEdge (that is, to associate more data with an edge), we replace those calls with a direct w.BuildSimpleEdge(_type, src, dst), removing the allocations. Again, this type of optimisation will only ever make a difference if called in a very hot path. We might also simply do it for clarity though.
Impact
Overall the impact of all of the described changes was quite significant and this can also be seen in the profiling data.
We can largely not see any more specific areas that still stick out — memory allocations and GC are the two biggest pain points now and as said we can only do so much about reducing them in the type checker, as we don’t (want to) control that piece of code.
In numbers, the running time now looks a lot better too:
SHIFTLEFT_COMPRESSION_METHOD=0 go2cpg generate ./...
14.23s user 1.03s system 250% cpu 6.091 total
14.94s user 0.97s system 253% cpu 6.280 total
14.49s user 0.86s system 243% cpu 6.299 total
14.54s user 0.99s system 251% cpu 6.180 total
13.71S user 1.06s system 250% cpu 5.906 total
avg. 14.382s user 6.151s total
Another piece where we’re still aware of relatively easy changes is the AST rewriting, which is again using the standard tooling from go/ast/astutil, which unfortunately also relies on reflection for some fairly heavily used iterations. Taking that library code and rewriting it for performance does away with costly reflection calls at the cost of code duplication (we're basically copying the same generic algorithm for several types, a part of the code that would very much benefit from generics, incidentally).
Lastly we’re still seeing costly operations in the Protobuf code, but except for finding a way to cache or reuse structures there, perhaps via a pooling mechanism, it doesn’t seem very likely we’ll be able to reduce the work in that area.
We’re still looking into larger scale algorithmic changes to further reduce the work. This falls in the domain of excluding code to be analysed, tuning the standard library tooling and moving operations from the frontend to our backend (which unfortunately wouldn’t decrease the total running time though).
Conclusion
We managed to optimise one of our source-code-to-CPG conversion frontends to take less than half the previously observed running time in the context of a fairly big “real life” project.
Doing this required investigating the actual time taking in various places of the applications process, from simple drop-in replacements of used libraries for better optimised counterparts, to removing unnecessary work and memory allocations.
All in all this was a great result compared with the hours invested in it and we’re hopeful to further continue down this path given more time and detailed profiling data from actual customer projects.
An Optimisation Story: Building a Code Scanner for Large Golang Apps was originally published in ShiftLeft Blog on Medium, where people are continuing the conversation by highlighting and responding to this story.
*** This is a Security Bloggers Network syndicated blog from ShiftLeft Blog - Medium authored by Olof-Joachim Frahm. Read the original post at: https://blog.shiftleft.io/an-optimisation-story-building-a-code-scanner-for-large-golang-apps-efabd17258ea?source=rss----86a4f941c7da---4
