

Fluid Attacks’ Perfect Accuracy
At Fluid Attacks, we are very proud of the great goal we have recently
achieved with our open-source tool, which we constantly develop and
employ to detect some systems’ vulnerabilities. This tool has reached
100% in True Positives and 0% in False Positives against the OWASP
Benchmark version 1.2. Let’s put this achievement in context:
What is the OWASP?
Perhaps you’ve heard of the OWASP
Top 10 list of vulnerabilities.
The Open Web Application Security Project (OWASP)
is a non-profit foundation committed to helping improve software
security through various means. The OWASP functions as an open, online
community where anyone can contribute to the production of material in
the field of web application security and benefit from the information
available. Fluid Attacks is an active corporate member of The OWASP
Foundation.
What is the OWASP Benchmark?
The OWASP Benchmark Project
is a free Java test suite created in 2015 to assess the accuracy, speed,
and coverage of automated software vulnerability detection tools. It
helps determine the strengths and weaknesses of different application
security testing (AST) machines and allows objective comparisons between
them. So, we can put under evaluation static (SAST), dynamic (DAST), or
interactive (IAST) tools. This benchmark is quite helpful for choosing a
new tool on the market or finding out what needs to be improved in the
machine you have been developing.


The most recent version of the OWASP Benchmark (v1.2), a fully
executable open-source web app, contains 2,740 test cases (single Java
servlets). Each case has either a genuine, exploitable vulnerability or
a false vulnerability, all of them belonging to 11 categories and
corresponding to specific CWEs. If we refer to all test cases, 51.6%
have actual exposures (multiple variants of each category), and 48.4%
contain false ones. In short, the best tools according to this benchmark
should only report those real vulnerabilities.
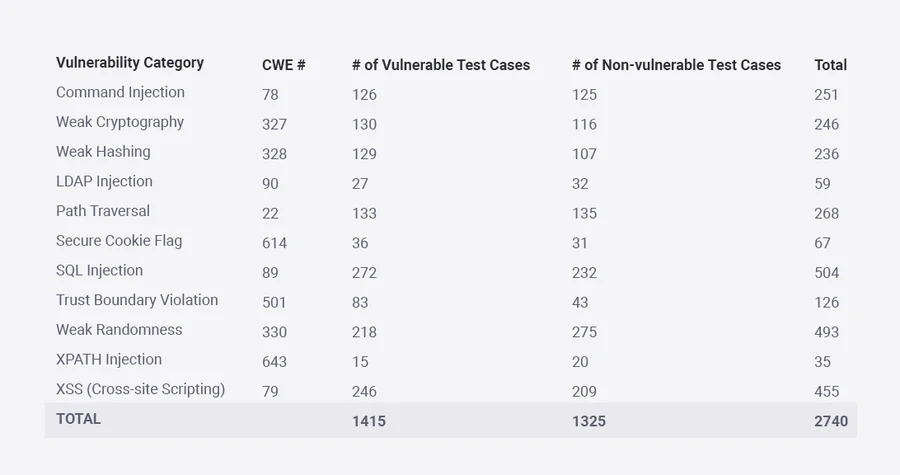
Figure 1. Test cases in OWASP Benchmark v1.2.
Companies have long relied on SAST and DAST solutions to protect their
applications and verify compliance requirements. However, it has been
pretty usual for automated vulnerability detection processes to show
errors in their reports. Thus, through this benchmark, for example, we
can realize that a tool may fail to identify real vulnerabilities (it
has False Negatives, which we have also referred to as omissions) and
may fail to ignore false vulnerability alarms (it gives False
Positives). On the other side, we can find that a tool may correctly
identify real vulnerabilities (it gives True Positives) and ignore false
alarms (it has True Negatives).
Accordingly, referring to some extreme cases we don’t want to witness,
there may be a tool that reports every line of code it reviews in an
application as vulnerable. That would help us detect all the
vulnerabilities present; however, we would also be full of false
positives, and it would be worthless. The same quality would be valid
for a tool with zero false positives but which cannot detect any
vulnerability. Finally, it would be useless to have a tool that randomly
has 50% true positives and 50% false positives. See the following chart:

Figure 2. OWASP Benchmark Results Interpretation
Guide.
True Positive Rate (TPR) is the percentage of true vulnerabilities that
the tool identifies. False Positive Rate (FPR) is the percentage of
false vulnerabilities that the tool reports as true ones. The ideal
point is where we have a TPR of 100% and an FPR of 0%. Anyway, it will
always be preferable to be above the red segmented line (“Random
Guess”), with the first rate’s value always exceeding that of the second
one; the farther away, the better. Be careful because it seems that some
vendors may strive to display you 100% in TPR as if it were the sole
relevant value when it comes to accuracy.
This is where the Benchmark Accuracy Score comes in. It is essentially
an individual score, a Youden’s
index, that goes
from 0 to 100 to summarize the accuracy of a set of tests. The equation
is simple: we just need to subtract one (1) from the sum of the tool’s
sensitivity (same as TPR) and specificity (same as 1-FPR) expressed as
part of a whole number. See this example taken from the OWASP’s website:
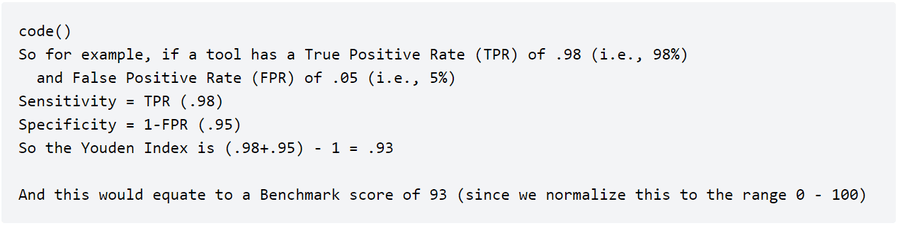
Figure 3. Example of the Benchmark Score (here in
‘Scoring’).
Consequently, the Benchmark Score for a tool with insufficient accuracy
equals 0, and for a tool with perfect accuracy equals 100 (Youden’s
index equals 1). In Figure 4, the Benchmark Score, which can also be
negative, corresponds to the line’s length from a given point down to
the diagonal “Random Guess” line.
What are Fluid Attacks’ results?
At Fluid Attacks,
we decided to test our primary,
customized tool.
Only by applying the SAST technique
(although it can also perform DAST),
this tool can achieve the best possible outcome against the OWASP Benchmark
with a TPR of 100% and an FPR of 0%.
So,
our Benchmark Score equals 100,
the highest value!
A few years ago,
developers in the OWASP Benchmark project published a comparison chart
for different open-source and commercial SAST tools.
It is now in this chart
that we include the results obtained by our tool.
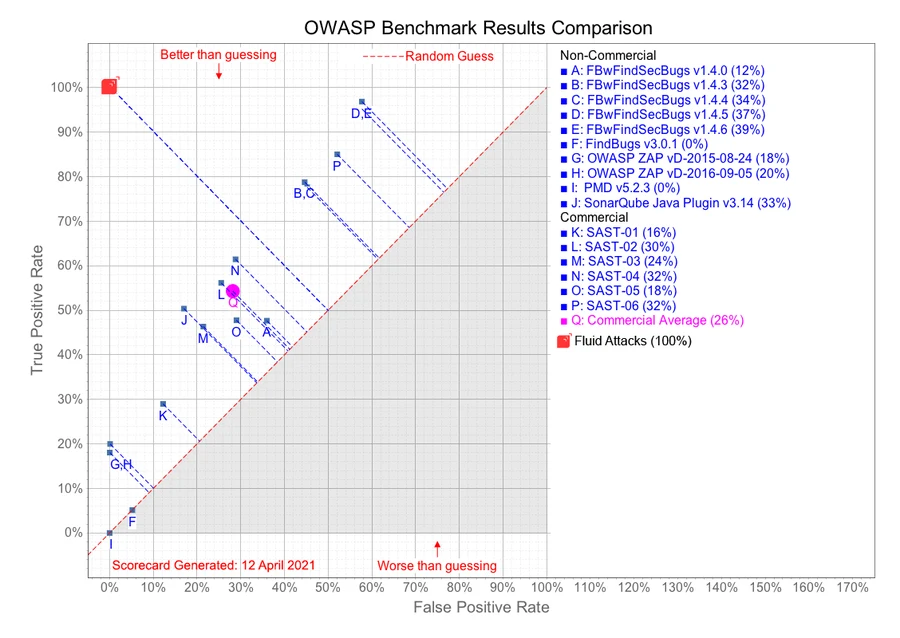
Figure 4. OWASP Benchmark results comparison.
Issues we’re aware of at Fluid Attacks
The values obtained in this scenario are easy to determine accurately
because the number of existing vulnerabilities is known from the
beginning, contrary to what usually happens in real-world applications.
You need to understand that this project does not include all
vulnerability categories and possible cases. Nevertheless, looking
ahead, OWASP hopes to have all types of vulnerabilities that belong to
its Top 10 in its tests and offer code in other languages, not just
Java.
OWASP created these test cases from coding patterns observed in actual
applications, but some of them may be of questionable relevance, and
most are simpler than in reality. Companies that focus only on improving
their machines and getting excellent scores, particularly in these types
of benchmarks, could be severely limited when facing a greater variety
of real-world code. So, it would help you keep in mind that a good
result in this test is not enough to assume that a tool will do very
well in detecting vulnerabilities in general: beware of false illusions
of security!
At Fluid Attacks, we are proud to have achieved this goal with the
OWASP Benchmark, but certainly, it is only one of the sources we use as
a reference to improve our tool. We keep getting feedback from real
applications. And while our customers can take advantage of our tool to
look for vulnerabilities, we always recommend performing comprehensive
security testing
by adding our ethical hackers‘
invaluable manual work.
To conclude, as anyone can use the OWASP Benchmark to evaluate any
application security testing tool, if you are among the customers or
stakeholders who want to prove for themselves that our results are
authentic, you can follow this
guide.
Additionally, if you want to learn more about our tool, don’t hesitate
to contact us!
*** This is a Security Bloggers Network syndicated blog from Fluid Attacks RSS Feed authored by Felipe Ruiz. Read the original post at: https://fluidattacks.com/blog/owasp-benchmark-fluid-attacks/
