

Simple Trend and Anomaly Detection with SQL
Introduction
Have you ever wondered if you can detect highlights based on your data using only your database engine? Well, the answer is yes. Simple trend detection and anomaly detection can be done with SQL. In fact, in many cases it may be enough for your needs, and save you the trouble of using more complex methods.
Letting the SQL engine do the hard work can improve performance and costs:
- No data is transferred outside of the DB.
- Calculations and aggregations are done by the DB, which is what DBs do best.
Read more to learn about anomalies and trend detection methods using SQL, including query examples you can try on your own data.
The problem and the data
In this blog post we’ll use the following example events table:
| day | event_type | events |
| 2020-11-30 | 29165 | 824 |
| 2020-11-30 | 51446 | 25620 |
| 2020-11-30 | 28465 | 121 |
| 2020-11-30 | 12345 | 72 |
| 2020-11-30 | 48315 | 8 |
| 2020-11-30 | 12335 | 5055 |
| 2020-11-30 | 26305 | 3 |
| 2020-11-30 | 19835 | 35528 |
| 2020-11-30 | 29705 | 22 |
| 2020-11-30 | 29925 | 1 |
| 2020-11-30 | 23253 | 3 |
There are thousands of event types and even more events. It is difficult to sift through so much data and find interesting highlights like peaks, drops and trends.
When we tried to group and visualize the data by event type over time, we got the following chart, which is completely useless:
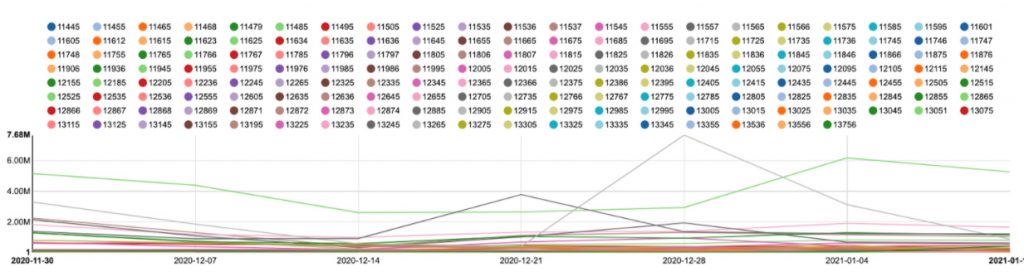
For one thing, it has a huge legend (we cut it for the post), and the scale differences created many lines in the body of the chart, most of which look almost flat.
So, now we understand the problem, let’s see how we can detect highlights easily using SQL.
Trend Detection using SQL
We used a linear regression slope to detect trends which required us to preprocess the data for the slope calculation. This involved:
- Converting the day string to a number according to day order.
- Normalizing the event count by the average event count
After that we were able to use presto’s REGR_SLOPE function. Here’s the query that returns the top 10 trends:
WITH normalized_data AS (
SELECT event_type,
RANK() OVER (PARTITION BY event_type ORDER BY day) AS day_number,
1.0 * events / AVG(events) OVER () AS normalized_events
FROM events)
SELECT event_type, REGR_SLOPE(normalized_events, day_number) AS slope
FROM normalized_data
GROUP BY event_type
ORDER BY ABS(slope) DESC
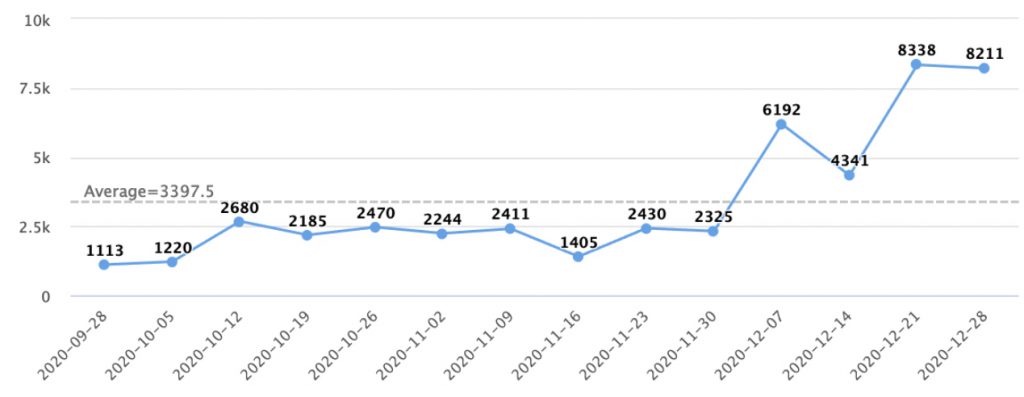
LIMIT 10Here’s an example of a detected event type trend:
In case your database doesn’t support the a linear regression slope calculation function, here is how you can do it with the basic aggregation functions:
WITH normalized_data AS (),
stats AS (
  SELECT event_type,
         AVG(day_number) AS day_avg,
         AVG(normalized_events) AS normalized_events_avg
FROM normalized_data
GROUP BY event_type)
SELECT event_type,
      SUM((day_number - day_avg) * (normalized_events - normalized_events_avg)) /
         (1.0 * SUM((day_number - day_avg) * (day_number - day_avg))) AS slope
FROM normalized_data INNER JOIN stats USING (event_type)
GROUP BY event_type
ORDER BY ABS(slope) DESC
LIMIT 10
Outlier Detection in SQL
Standard deviation is often used to find peaks and drops in time series. In our case, there are many event types, each with different STD. To be able to use a simple query for all the event types at once, we use relative standard deviation (RSD).
First we calculate the average and then, per value, we calculate the distance from the average to detect peaks and drops, and filter the results according to the required RSD:
WITH stats AS (
 SELECT event_type,
        AVG(events) AS avg_value,
        STDDEV(events) / AVG(events) AS rsd_value
 FROM events
 GROUP BY event_type)
SELECT event_type, day, events,
      ABS(1 - events / avg_value) AS distance_from_avg
FROM events INNER JOIN stats USING (event_type)
WHERE rsd_value <= 0.2 -- RSD threshold AND ABS(1 - events / avg_value) >= 0.4 --Distance threshold
ORDER BY distance_from_avg DESC
LIMIT 10
Two important parameters for the query are:
- RSD threshold. If the RSD of a series is high, peaks and drops are frequent and are less likely to be important.
- Distance from average threshold. The minimal distance from the average to be considered as a highlight.
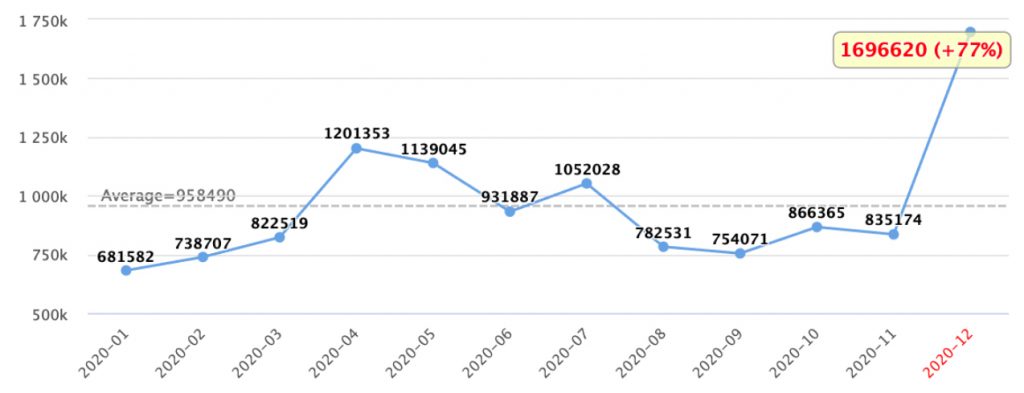
Here is an example of a detected peak for a specific event type:
While we used the RSD and distance from average parameters, you can use other methods like distance from median or z-score. Switching methods is pretty simple and you can decide which best suits your needs.
Peaks and drops detection in a defined timeframe
The method above uses statistics over the data from the entire time frame of the data. To find peaks and drops in a small time window, you can use the window functions functionalities BETWEEN, PRECEDING and CURRENT ROW. In the example below, we use REGR_SLOPE (yet again) to find slopes in a small time frame.
SELECT event_type,
normalized_events,
day_number,
REGR_SLOPE(normalized_events, day_number) OVER (PARTITION BY event_type ORDER BY day_number
ROWS BETWEEN 3 PRECEDING AND CURRENT ROW) AS local_slope
FROM normalized_data
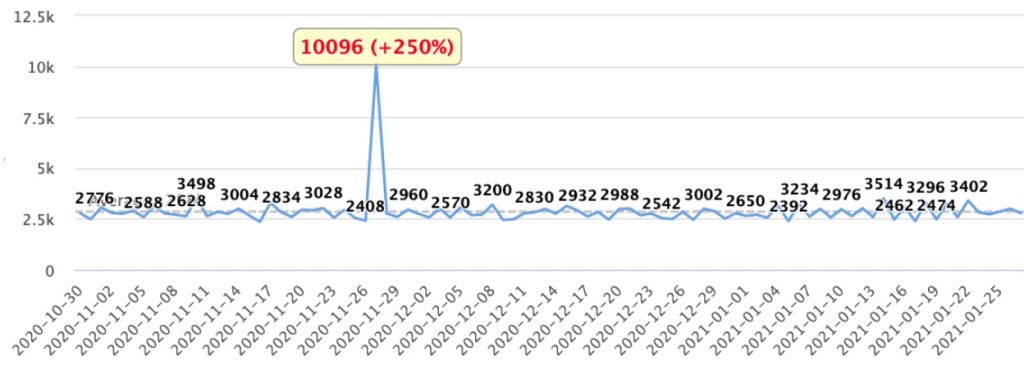
ORDER BY ABS(local_slope) DESCAn example to one of the peaks the query detected:
REGR_SLOPE is one example of a calculation over a small time window. You can use the same method for smoothing your data (e.g with AVG) or transform your data into a cumulative time series using UNBOUNDED PRECEDING and SUM.
What’s next
In this blog post we showed three simple methods to find interesting highlights in your data. Small changes in the query, like using different statistical functions, different normalization methods, or a different time window can help you tailor the query to your own needs.
You can check if it works for you by simply running a query – isn’t it worth a try?
The post Simple Trend and Anomaly Detection with SQL appeared first on Blog.
*** This is a Security Bloggers Network syndicated blog from Blog authored by Ori Nakar. Read the original post at: https://www.imperva.com/blog/simple-trend-and-anomaly-detection-with-sql/
