

Ransomware Attacks Fracture Between Enterprise and Ransomware-as-a-Service in Q2 as Demands Increase
Table of Contents
Ransom Demands Rise With Market Share Split Between Big Game Hunters and Amateur RaaS Affiliates
The Coveware Quarterly Ransomware Report describes ransomware incident response trends during Q2 of 2020. Ransomware attacks against enterprises forked in Q2 between big game attacks and an increase in new RaaS variants targeting small businesses. Victim demographics and resolution metrics are aggregated to present ransomware incident response statistics driven by actual case events.
In Q2, the average ransom payment increased while the number of attacks decreased among the top ranking variants. Market share by variant was more distributed in Q2 than in Q1. This was driven by increased attacks from small, opportunistic ransomware threat groups, utilizing new and low-cost ransomware-as-a-service (RaaS). The availability of free, do it yourself RaaS kits, and cheap attack ingredients pushed the barrier to entry extremely low. Deep technical expertise is no longer needed to participate in the cyber crime economy. It is also possible that the increase of RaaS usage is related to the economic impact of the Coronavirus pandemic, driving more financially stressed individuals towards cyber crime. On the lower end of the market, cheap RaaS services to target the softest, smallest targets; small businesses that simply do not have the resources to defend themselves.
Average Ransom Payment Up 60% From Q1
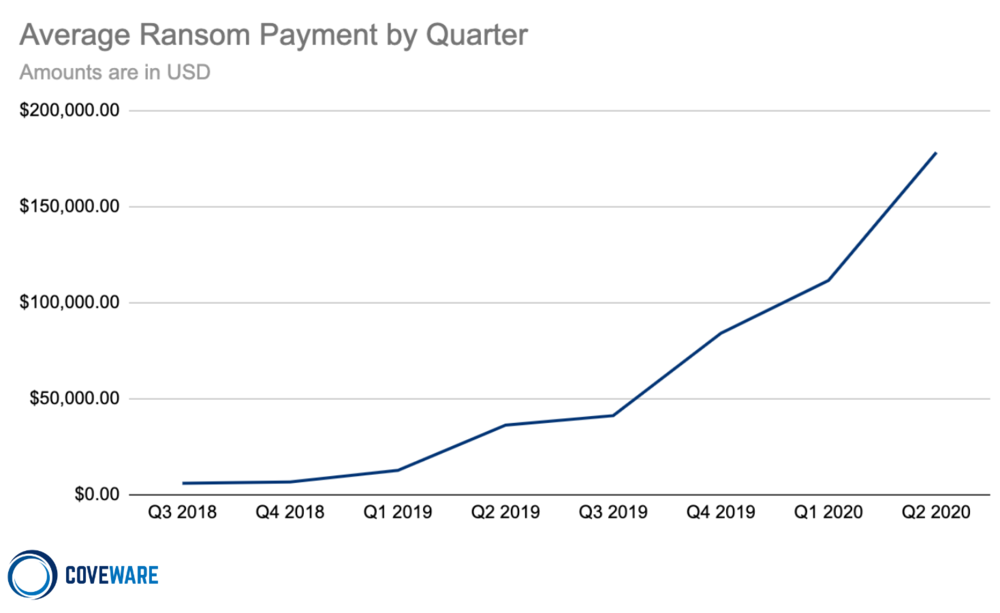
Average Ransom Payment
$178,254
+60% from Q1 2020
The average ransom payment in Q2 was $178,254, a 60% leap from the $111,605 average in Q1. Average ransom payments climbed steadily since 2018, which coincided with the arrival of the first “big game hunting” ransomware variants, BitPaymer and Ryuk. Prior to big game tactics, the ransomware sphere was dominated by opportunistic spray-and-pray threat actors who rarely exercised victim profiling and issued nominal demands that remained constant whether the victim was a 10-person company or a 1,000 person enterprise.
Multiple factors contributed to the continued price climb, but there are two noteworthy trends:
Data exfiltration continues to become more common
This trend started in November 2019 among certain ransomware families and emboldened them to increase their ransom demands, citing the added ramifications a data leak could cause on top of the ransomware event. Data exfiltration resulted in ransom payments from companies even where ransomware recovery from backups was possible.
RaaS variants want big returns too
Six and seven-figure demands have become routine among ransomware families targeting large enterprises, but now historically modest RaaS operations are seeking higher ransom demands. For instance, Q2 marked the first series of six-figure ransom payments to the Dharma group, an affiliate ransomware platform that for years has kept pricing in the mid-to-low 5 figures, and lower.
Attack Types – Spear Phishing and RDP Based Attacks Are On The Rise
Market share of ransomware variants became more distributed
In Q1, nearly 60% of ransomware attacks were carried out by the three most common variants (Sodinokibi, Maze, Phobos). However, in Q2 only 30% of attacks were attributed to the top three families. The other 30% was distributed among smaller and/or newer variants, such as Mamba, Snatch and DeathHiddenTear. Q2 also introduced several new RaaS variants such as LockBit, Payment45, Lock2bits, MedusaLocker and others. These new entrants entice cybercrime beginners with low upfront costs and little technical expertise required. Notably, Ryuk’s share plummeted from nearly 20% in Q1 to a mere 5% in Q2. This plunge aligned with the relative disappearance of Ryuk attacks around March 2020.
| Rank | Ransomware Type | Market Share % | Change in Ranking from Q1 2020 |
|---|---|---|---|
| 1 | Sodinokibi | 15.4% | – |
| 2 | Maze | 7.7% | +7 |
| 2 | Phobos | 7.7% | +1 |
| 4 | Netwalker | 7.1% | +6 |
| 5 | Dharma | 6.4% | -2 |
| 6 | Ryuk | 5.1% | -4 |
| 7 | Mamba | 4.5% | -2 |
| 8 | Snatch | 4.2% | -1 |
| 9 | Lockbit | 4.2% | +4 |
| 10 | DeathHiddenTear | 3.9% | +4 |
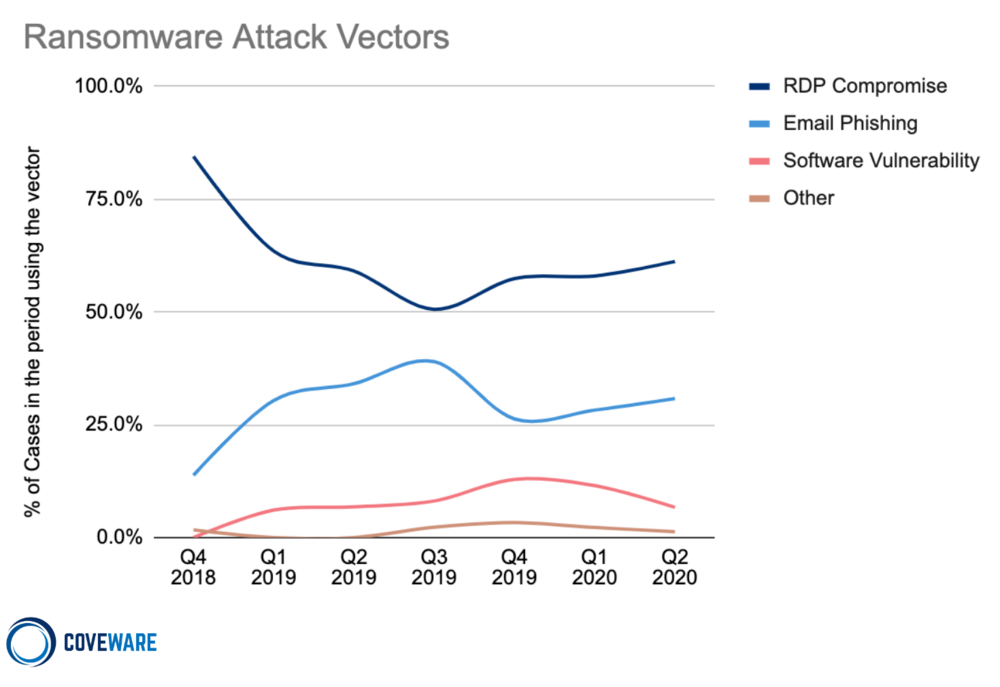
RDP on the rise for small and medium size enterprises
An examination of reported attack vectors from the past quarter shows a subtle but distinct increase in Remote Desktop Protocol (RDP) intrusions and email phishing, with a slight decrease in software vulnerabilities and other assorted vectors.
An uptick in RDP and phishing comes as no surprise given the increase in amateur affiliate-based ransomware services; remote intrusion and malware delivery via phishing require little expertise.
Additionally, Q2 marked the mass exodus of many employees from their workplaces to the home, increasing RDP usage by 41% and expanding the attack surface area for threat actors to explore. Although the data points to a downturn in the use of software vulnerabilities, exploits of this nature are less likely to leave tangible forensic evidence of their occurrence. Organizations are less likely to have the elevated level of logging necessary to capture the minimal footprints that are left behind. It is possible that these kinds of attacks are still occurring at the same (or higher) rate and there simply isn’t the same quality/volume of corroborating evidence to report them as such.
What are the Most Common Ransomware Attack Vectors?
Comparing the Top 3 Types of Ransomware – Sodinokibi, Maze and Phobos
Comparing the Top Three Types of Ransomware by Attack Vector
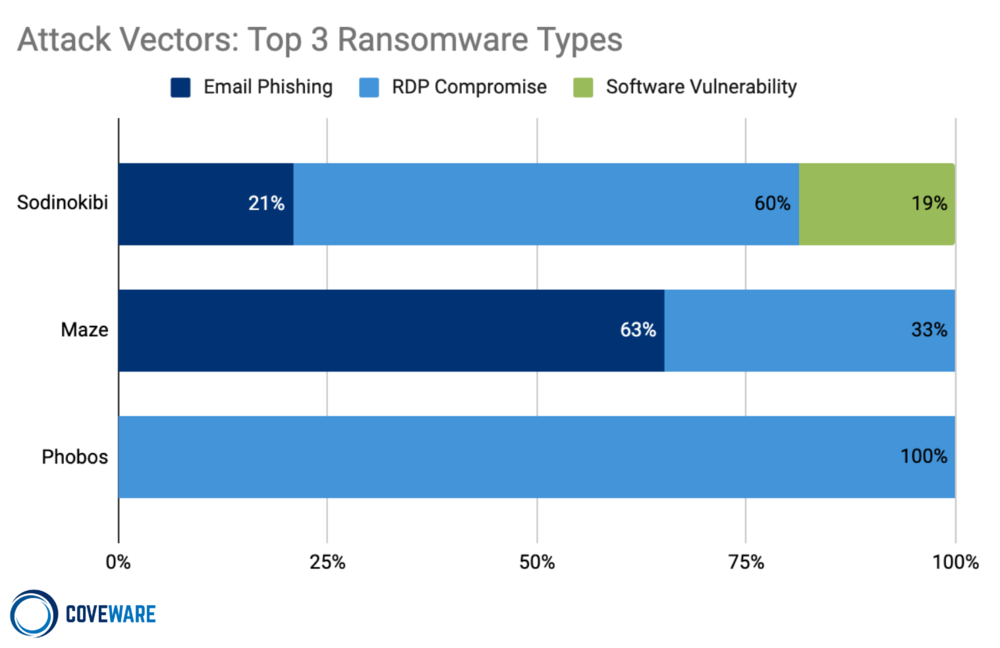
The attack vectors used by a threat actor group is indicative of the size of the targets they favor. Phobos almost exclusively targets small businesses via insecure RDP configurations. This exploit is cheap, prevalent and requires little technical sophistication to stage.
Maze utilizes RDP on smaller companies, but typically uses email phishing to target larger more secure organizations. The phished employee’s account is used as an initial foothold to perform privilege escalation and network enumeration. Privilege escalation will be complete once admin credentials and control of a domain controller are obtained.
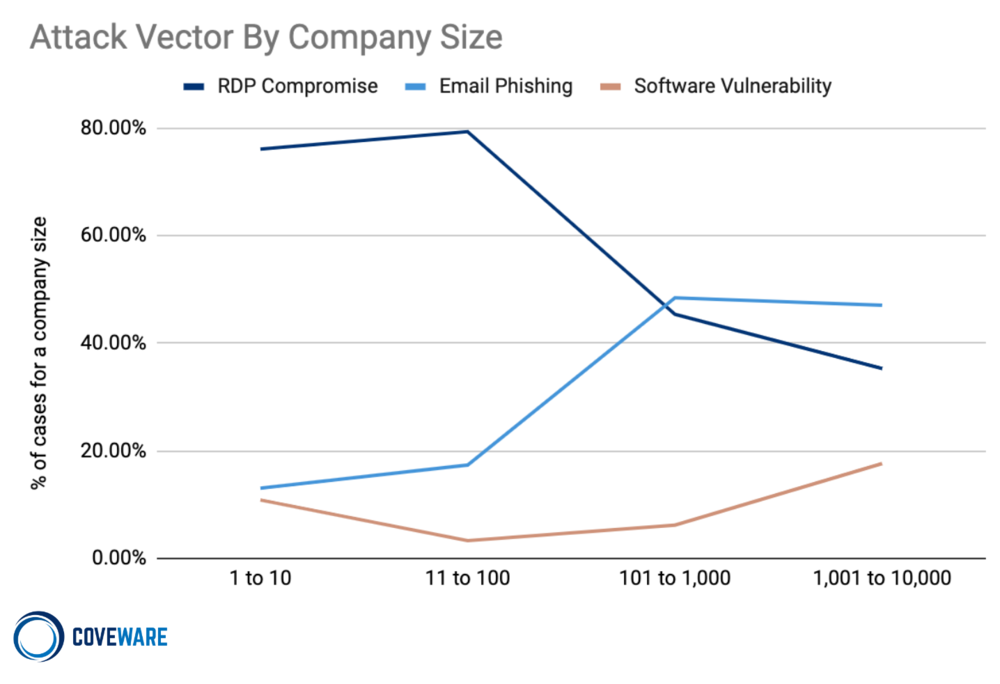
Comparing the Top Three Types of Ransomware by the Size of the Victim Company
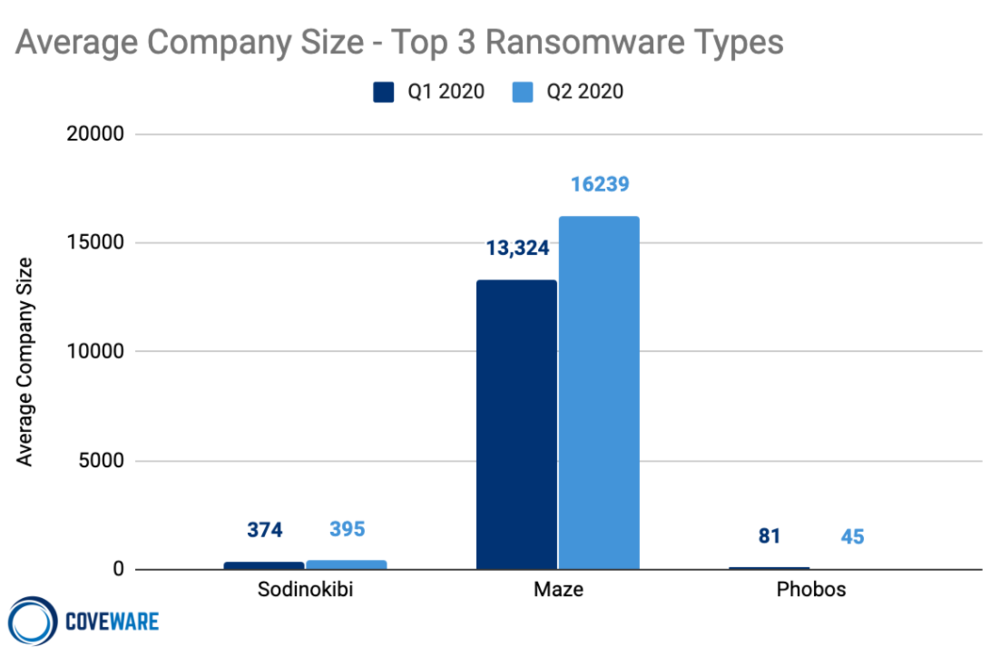
There is a clear relationship between a company’s size and the type of ransomware most likely to infect their networks. On the lower end of the market, cheap RaaS services like Phobos tend to target the softest, smallest targets; small businesses that simply do not have the resources to defend themselves. Although large scale ransomware attacks make headlines, small businesses that don’t have a sufficient budget for security are arguably a larger economic risk. Small businesses are the backbone of the U.S. economy and ransomware actors have created massive financial and data loss in America’s largest source of employment and output.
An Evolving Threat: Maze Organization Develops Specialized Expertise
In the large enterprise segment, the Maze group scaled their organization dramatically during Q2. As an organization, Maze increased the volume and size of attacks along with the size and complexity of its affiliates. The definition of a ransomware ‘affiliate’ is no longer limited to a distributor that carries out attacks. Maze currently relies on a host of other specialists to carry out and extort their victims. The specialists include people skilled in TOR cloud bulletproof hosting, cloud data storage and migration, front end web development, and facilitating negotiations. All of these are separate skill sets, and Maze uses a network of different people in each of these groups to run their organization.
Companies Targeted by Ransomware
Schools And Small Businesses Frequent Targets in Q2
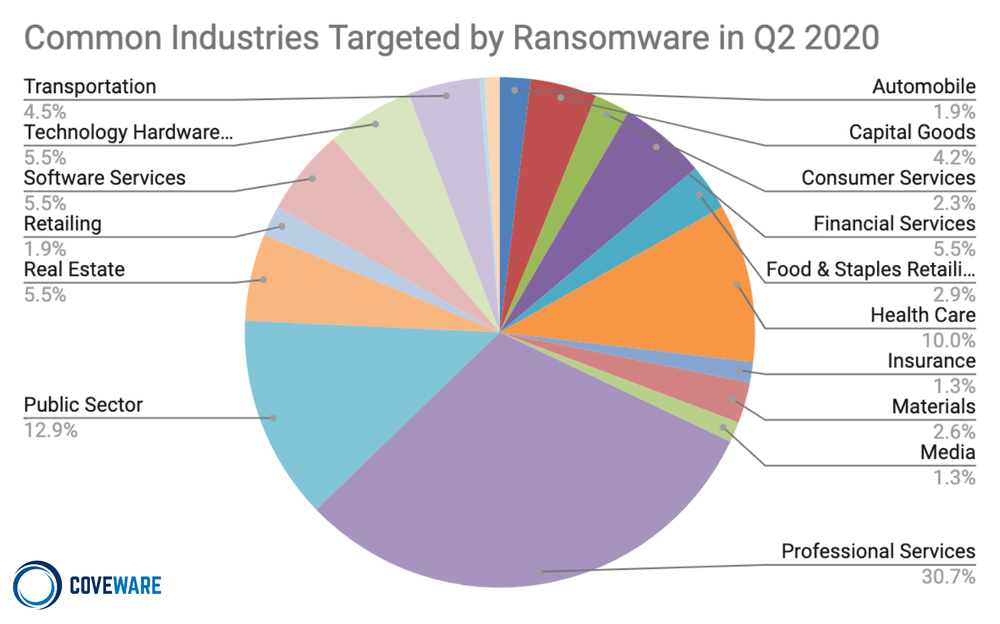
Q2 saw a marked increase within Professional Services firms and also within the public sector. The prevalence of ransomware infections by industry is an expression of that specific industry’s tendency to have favorable (i.e. cheap for the threat actor) exploits available. However, many threat actors will time their ransomware attacks in order to maximize their ransom payments.
A good example of this occurred with school districts (Public Sector) during Q2. School districts are typically targeted in July and August. The seasonality is deliberate; the threat actor wants to cripple the school right before school starts. In Q2, schools globally made a rapid, overnight shift to remote learning. The hastiness with which the shift occurred left many remote access vulnerabilities open. The number of vulnerable and cheap school targets increased, and the attacks quickly followed. In fairness to the security administrators of these organizations, the pressure and timing to adopt remote learning was completely unexpected.
Median # of Employees
100
+67% from Q1 2020
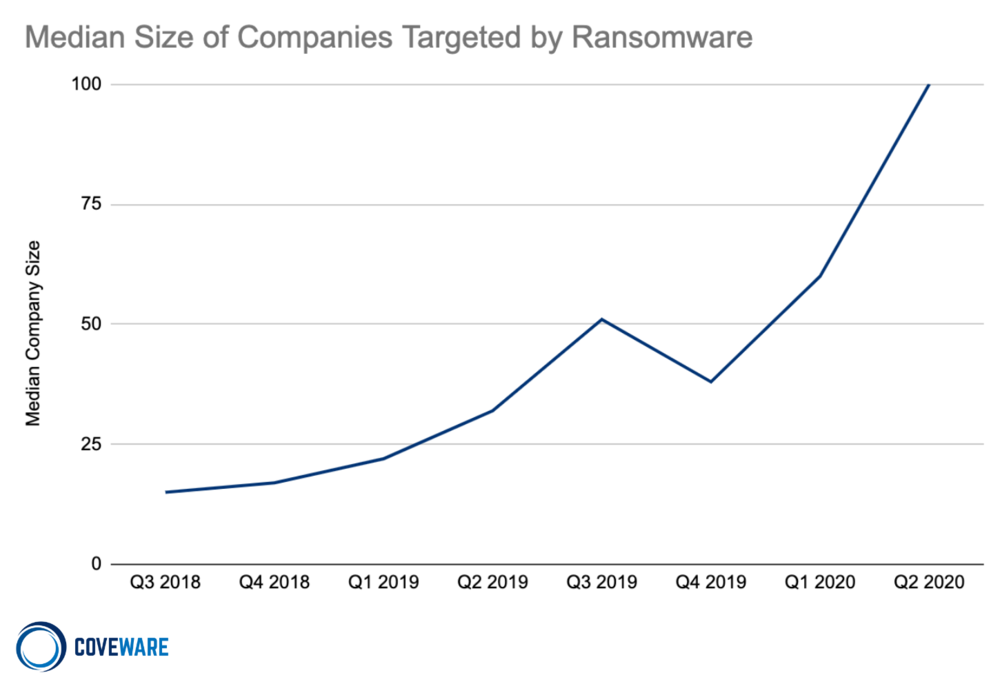
The median company size (by employee count) rose substantially in the past 2 years, but remains well below the large enterprise level. Large enterprises are increasingly falling victim to ransomware, and are pulling up the average and the median metrics. The median company size in Q2 was 100 employees, up 67% from Q1 2020.
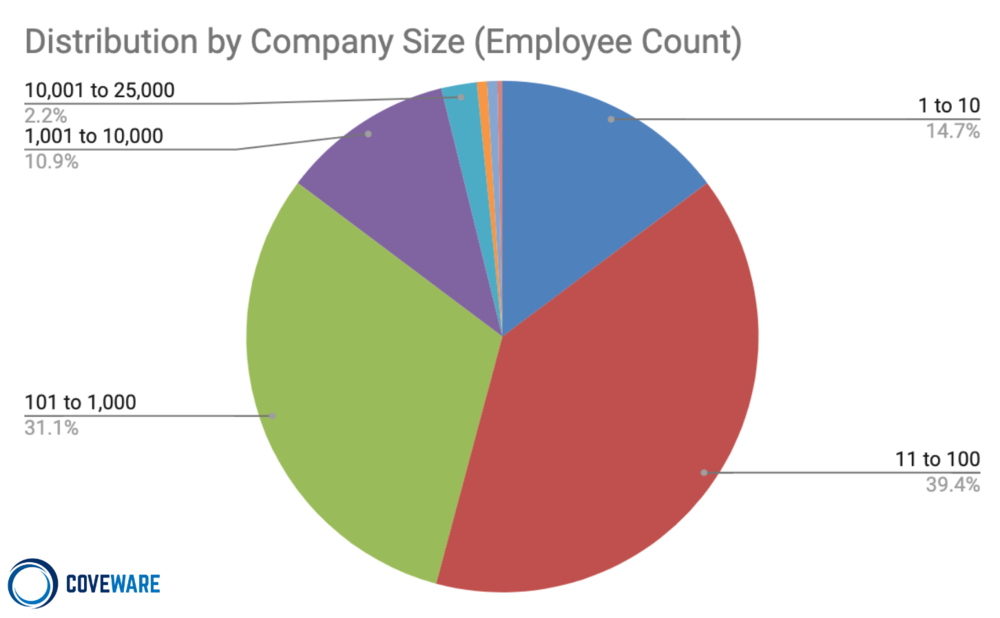
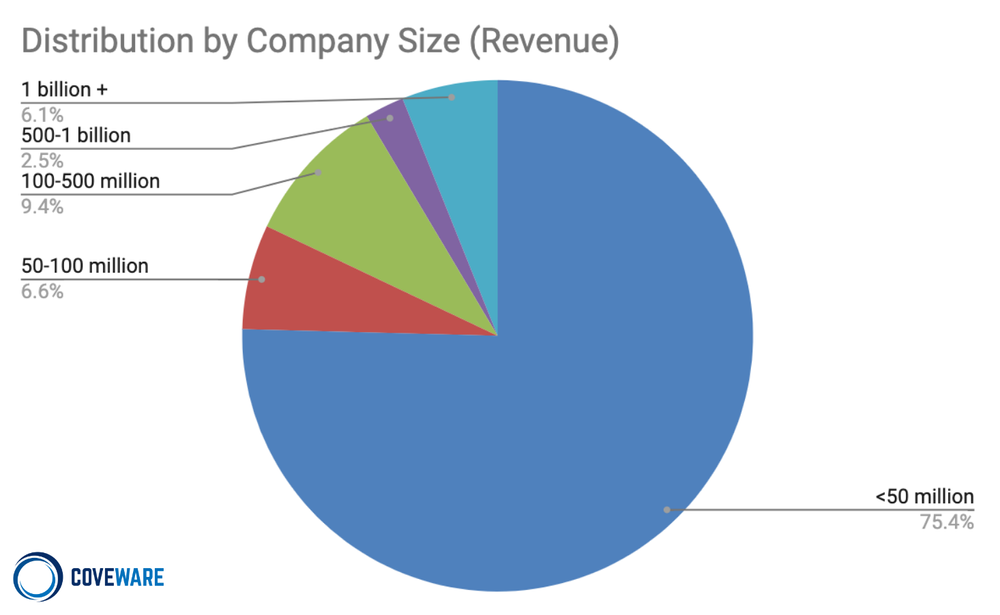
Ransomware remains a predominantly ‘small business’ problem. 55% of total enterprise attacks took place on companies with less than 100 employees, and 75% of attacks occurred on companies with less than $50mm in revenue. While large ransom demands and large company victims drive the headlines, small companies with insufficient security budgets or resources continue to get victimized daily. Until small and medium sized companies have the knowledge and tools to defend themselves in a cost effective, time efficient manner, this trend is likely to continue.
Data Recovery After Ransomware Attacks
The trends in defaults and data recovery remained relatively constant in Q2. We recognize that our specialization in these types of matters may skew the results vs. a victim of ransomware that may attempt to negotiate, pay, and decrypt their data on their own.
Payment defaults remain rare and occured just 2% of the time, though some variants had a much higher default rate than others. The efficacy of the decryption tools also varies widely across variants. While a victim’s data files may be recovered, we are increasingly seeing corruption of operating systems, and permission registries. Rebuilding machines and permissions policies often adds substantial downtime costs.
Exfiltrating Data AND dropping Ransomware is becoming the new normal
Cases with data exfiltration
22%
+8.7% from Q1 2020
In Q2, 30% of ransomware cases included a threat to release exfiltrated data and 22% of cases actually had exfiltrated data. This was up from 8.7% in Q1 2020. The number of variants currently using data exfiltration plus ransomware as a combination extortion tactic has increased to over a dozen variants in Q2. The top ransomware variants that currently employ this tactic include:
Nephilim
Cl0p
Sekhmet
RagnarLocker
Maze
REvil/Sodinokibi
DoppelPaymer
Mespinoza (PYSA)
Netwalker
AKO/MedusaReborn
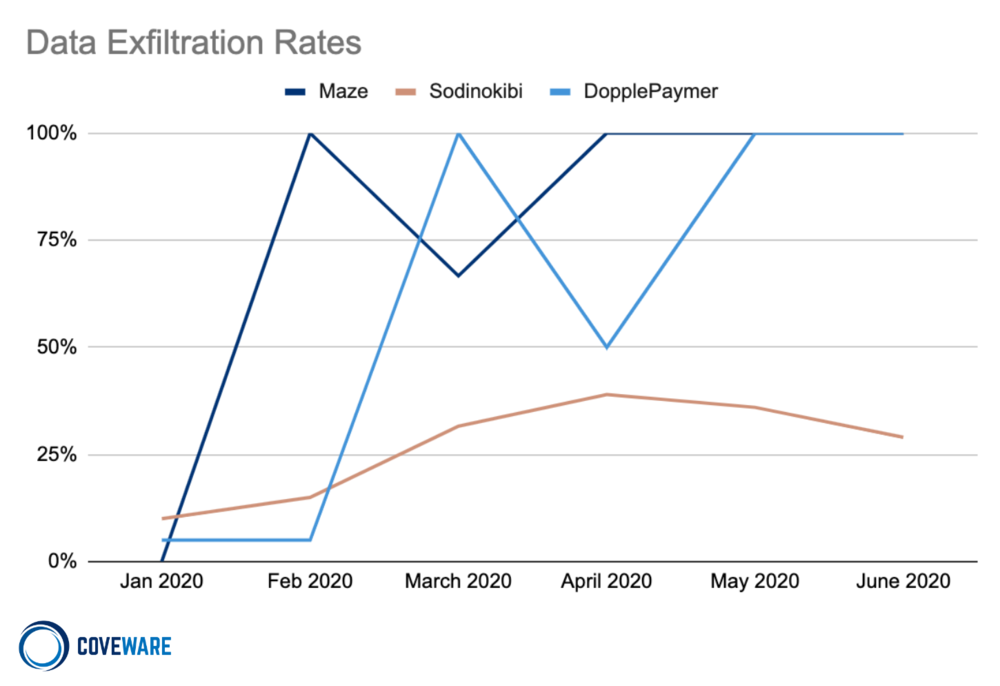
From the threat actors perspective, data exfiltration is a ‘conversion tactic’, meant to force victims to quickly pay a ransom demand. The intent is not to profit from the value of the data taken through resale, but to coerce more companies to pay that would have otherwise recovered from their backups. Just like any business aims to optimize the conversion of their revenue pipeline, data exfiltration is no different from a purely economic standpoint. As the graph shows, some ransomware groups always do it, and others do it some of the time. Being able to differentiate an empty threat from an actual data exfiltration is critical to managing recovery time and cost.
Costs of Ransomware Attacks in Q1 2020
Average Days of Downtime
16
+7% from Q1 2020
The average days of downtime stayed relatively constant during Q2 at 16 days, up 7% from Q1 2020. Our downtime metrics do not reflect the time an enterprise is 100% inoperable, but the time that they are experiencing material business interruption. The total time to recover from a ransomware attack, especially in very large companies is typically measured in months. Managed services providers are still not appreciating the risks of ransomware.
Disclaimer
Coveware is not responsible for any actions taken, errors or omissions (negligent or otherwise), regardless of the cause, or for the results obtained from the use of this content, or for the performance of any computer, hardware or software used or modified in conjunction with this content. The content is provided on an “as is” basis.
VIEWERS OF THIS REPORT AND ITS CONTENT DISCLAIM ANY AND ALL EXPRESS OR IMPLIED WARRANTIES, INCLUDING, BUT NOT LIMITED TO, ANY WARRANTIES OF MERCHANTABILITY OR FITNESS FOR A PARTICULAR PURPOSE OR USE, FREEDOM FROM BUGS, SOFTWARE ERRORS OR DEFECTS, THAT THE CONTENT’S FUNCTIONING WILL BE UNINTERRUPTED OR THAT THE CONTENT WILL OPERATE WITH ANY SOFTWARE OR HARDWARE CONFIGURATION.
In no event shall Coveware be liable to any party for any direct, indirect, incidental, exemplary, compensatory, punitive, special or consequential damages, costs, expenses, legal fees, or losses (including, without limitation, lost income or lost profits and opportunity costs or losses caused by negligence) in connection with any use of the content even if advised of the possibility of such damages.
*** This is a Security Bloggers Network syndicated blog from Blog | Latest Ransomware News and Trends | Coveware authored by Bill Siegel. Read the original post at: https://www.coveware.com/blog/q2-2020-ransomware-marketplace-report
