

Using SARIF to Extend Analysis of SAST Tools

The static analysis interchange format (SARIF) is now an approved OASIS standard. We have discussed in other posts the benefits of having a standardized format for static analysis. First and foremost, among those benefits is the ability for tools from different vendors to exchange information without relying on various proprietary formats and custom software to integrate them.
A common use for SARIF is displaying and interacting with SAST tool results in integrated development environments (IDE.) The first such example we showed is CodeSonar working with Microsoft VS Code which supports SARIF. However, the possibilities are endless and it is entirely possible to do further analysis on CodeSonar results using SARIF.
Imagix 4D Enhances CodeSonar Results
Our partners at Imagix use SARIF in their Imagix 4D product to provide enhanced interpretations of CodeSonar results to help developers understand, debug and fix the reported issues. Imagix 4D imports results in SARIF format for each warning reported. It provides enhanced, graphical visualization of each, overlaying CodeSonar results (via SARIF) on to code analysis Imagix 4D has done from the same source. For example, the warning trace information provided by CodeSonar is represented as a visual call graph in Imagix 4D (used with permission from Imagix, more details are available on their blog on this topic):

Data flow is also important to help understand the root cause of a warning. In Imagix 4D, data flows are displayed graphically to help discover error sources since data flow often passes from function to function. The following is an example data flow diagram from Imagix 4D:
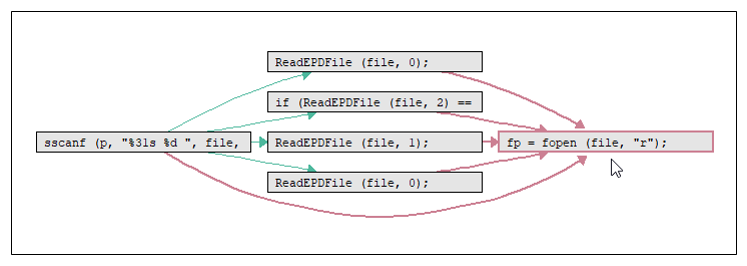
In this example, the data flow shows the scanf() function that is the root cause of the uninitialized variable warning. Imagix 4D goes further by providing a flow chart representation:

Imagix 4D allows developers to record the results of their investigation such as indicating the validity, priority and severity of the error. This progress is recorded for each defect and over time, an architectural distribution of the warnings is possible. Imagix 4D creates a distribution diagram of warning “hot spots” based on the analysis results:

Imagix 4D illustrates an important use case for SARIF in extending static analysis results to enhance the understanding of warning results. Using visualization, developers can diagnose and fix bugs more efficiently.
![]()
*** This is a Security Bloggers Network syndicated blog from Blog authored by Mark Hermeling. Read the original post at: https://blogs.grammatech.com/using-sarif-to-extend-analysis-of-sast-tools
