

Reversing and Exploiting with Free Tools: Part 2
In part one of this series, we focused on installing several tools that will be useful for reversing and exploiting security weaknesses on Windows. These tools are free to access, so anyone can use them to learn and try out the useful exercises that this article series will provide.
Before going into the exercises, let’s list and define some important concepts.
Bug: A bug is the result of a failure or deficiency during the process of creating computer programs (software). Such a failure can occur at any stage of the software’s life cycle, although the most obvious ones occur at the development and programming stage.
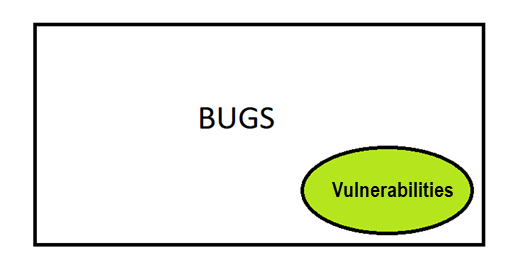
Vulnerability: Vulnerabilities are a subset of bugs. A vulnerability is a certain type of bug in a piece of software that allows, through exploitation, the security of a computer system to be compromised.
Vulnerabilities allow threat actors to perform actions for which the software was not intended and abuse them.
While there are many types of vulnerabilities, we are going to focus on studying Windows exploits, and their exploitation techniques.
Exploit: An exploit is software code that tries to use a vulnerability of other software.
The goal of the exploit could be malicious, such as destroying or disabling the attacked system.
More typically, exploits are used to violate security measures in order to be able to gain unauthorized access to information and use it for one’s own benefit or as a source of other attacks on third parties.
Threat actors can exploit a vulnerability to crash an application or even the whole system. They can also execute code on local or remote machines. Difficulty varies depending on the vulnerability, the environment, and the mitigations that the target has at the moment of exploitation.
Buffer Overflow
The first type of vulnerability we are going to study will be the buffer overflow, starting with the simplest example, building techniques step by step as we increase in difficulty. A buffer is a memory space of a certain size reserved for storing and managing data. A buffer overflow occurs when a computer program exceeds the amount of memory reserved for it by writing to the contiguous memory block.
Think of an empty 20 liter tank. You can store no more than 20 liters of liquid. If you want to store more in a single tank you need to find a larger buffer. Otherwise, when trying to store, say, 40 liters in that 20 liter tank, the liquid will overflow. This overflowing is the buffer overflow, or the overflow of the tank that exceeds the maximum capacity of it.
For instance, this can occur when a computer application doesn’t have the necessary security checks in its programming code, like measuring the amount of data that will be copied into a buffer ensuring that it does not exceed its size.
The most common types of buffer overflows are stack buffer overflows and heap buffer overflows.
A stack is used to store local variables of a function that are only needed while the function is executing. In most programming languages it is fundamental that we know a variable size for compile time if we want to store it in the stack.
The heap is used to reserve dynamic memory, whose need is not known in advance, but is expected to last a while. If we do not know a function’s size or it’s decided at runtime, it should be reserved in the heap.
It is also used for objects that vary in size, because we do not know at compile time how long they will last or what they will cover.
At Core Security, we often challenge new employees to solve the stacks and abos problem of one of our original founders, Gerardo Richarte. Challenge yourself to the stack exercises below.
Stack Exploitation Exercises
We will start step by step with the stacks that are the simplest, compiled with minimal protection to make it easier to start exploitation.
Let’s see the source code of stack1.
https://drive.google.com/open?id=16btJAetpa1V5yHDZE2bnnFWTQNpsUR4H
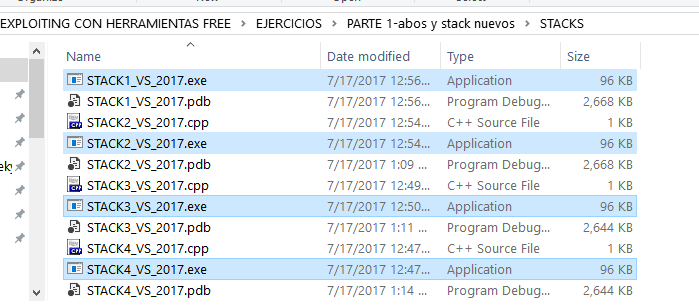
Here we have the exercises folder and inside it is the source code of the stack1 called STACK1_VS_2017.cpp.

Let’s try to understand this code and see where the buffer overflow can be produced, and if it will be an overflow buffer in the stack or in the heap.
A call to MessageBoxA that will show us a text that encourages us to solve it has been added to the code of the original stack1. It is just an addition that does not influence anything but is a standard call to Windows function that we will not analyze here.
We know that within a function, if there are local variables you must reserve space for them before starting with the instructions themselves.
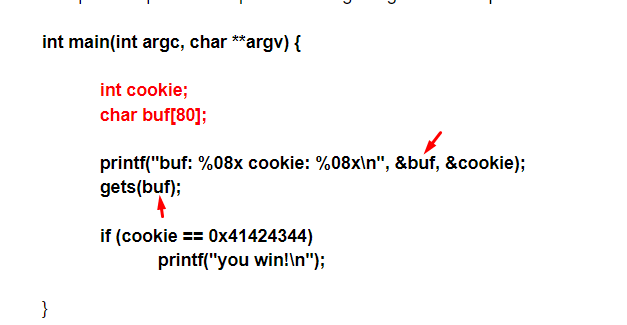
Below is some original code, created by Gerado Richarte:

The first part, in red, reserves the space for local variables. In this case there are two local variables, cookie and buf.
You can find them in the table of data types.

In the case of buf, we see that it is an array or string of char so as a char it has one-byte size.
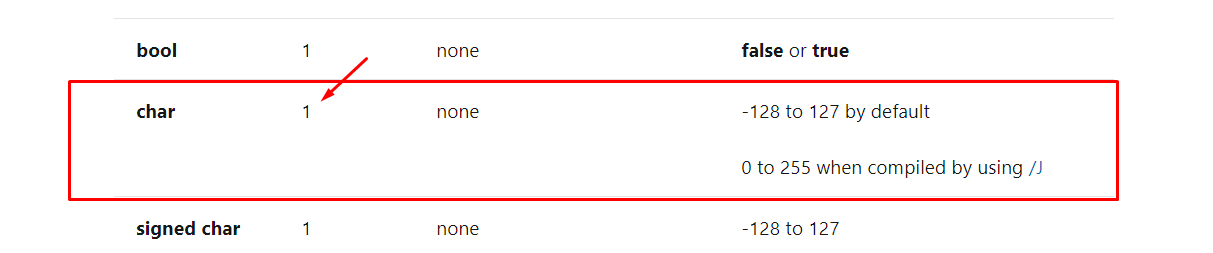
As an array, it has 80 chars, with 80 bytes length.
Creating an array can store many values of the same type of data. Begin with what type the data is and how many there will be.

In the first example, there is an array of100 ints. Since one int occupies four bytes, the total length would be 100 x 4= 400 bytes.
In the second example, one float occupies four bytes, so it would be an array of five floats. The final size would be 5 x 4 = 20 bytes.
When we analyze an array at a low level, we see that it is a reserved memory space or buffer, but it is not the only way to reserve space. There are other types of data variables that also require reserved space in the memory that will need buffers to keep its content.
Returning to our exercise:
This is a char array of 80 x 1 = 80 bytes long. Like our tank of 20 liters, if we try to keep more than 80 bytes it will overflow.
Next, we’ll discuss how the buffer or variable char array called buf (indicated below with red arrows) is used.
In the first instruction there is a printf that is used to show the string between the quotes as a console message
But printf not only prints the quoted string but also prints with formatting. The percentage characters inside tell us that it will form an output string. The string is just the first argument of the function and is in the output format. There can be several other arguments–one for each %.
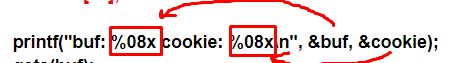
in this case, there are two %x. Next, we’ll check the table of field types for printf.
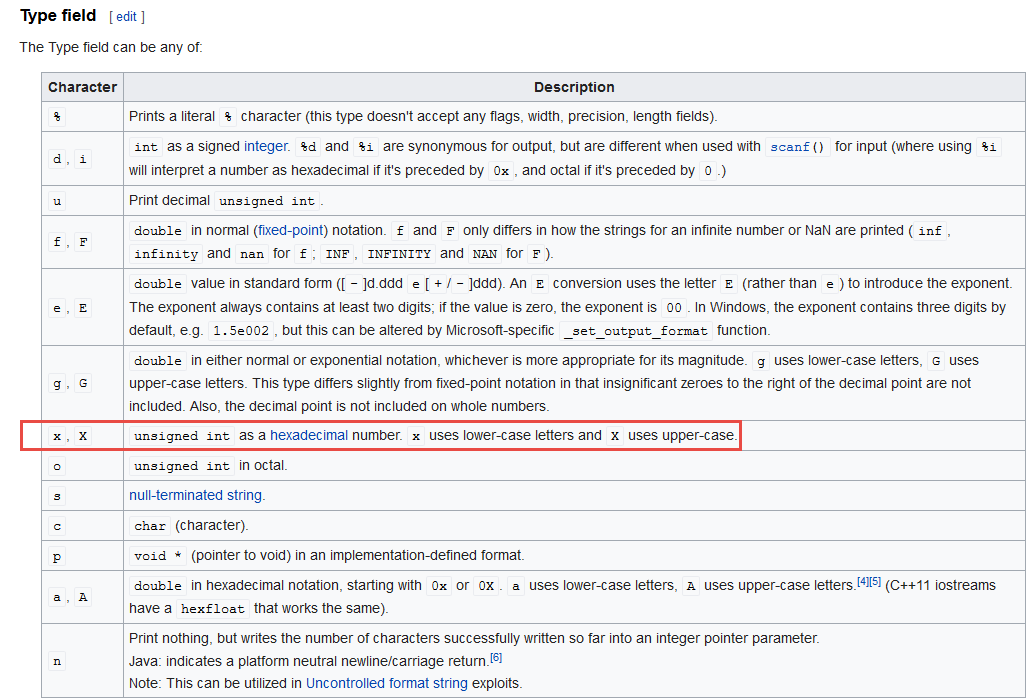
We see that it will take those integers (int) and insert them into the output string with base16–hexadecimal. The 08 refers to the fact that if the number has less than 8 digits it will be filled with spaces.

This example is filled with spaces before the number, so there are several modifiers to change the output, referred to as format specifiers.
In our case, our format specifier was [width].


The result is not truncated, but instead only fills in with spaces if the length of the argument to insert is less than the value in front of the x.
Therefore, we know that it prints two hexadecimal numbers that come from the two arguments.
We know that a variable has a memory address and a value to store. Like our 20-liter tank, it has its contents or value, which are the amount of liters it stores inside. But if I have a garage full of similar tanks, I need to have some way of knowing where the tank I want is located out of all the tanks I own.
This is indicated by the & (ampersand symbol), which tells us the direction or location of the tank, but not its contents or value. The ampersand is used to indicate the memory address of the variable where the data will be stored.
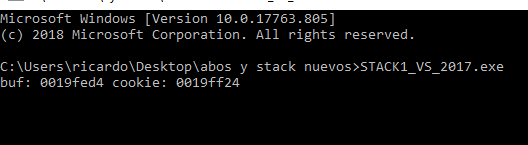
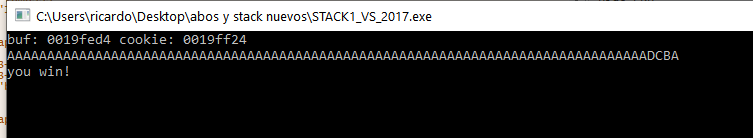
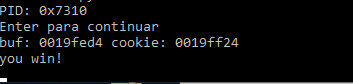
For instance, if I run the executable on a console I’ll see:
The above is merely one possible example. The output will vary depending on your environment.

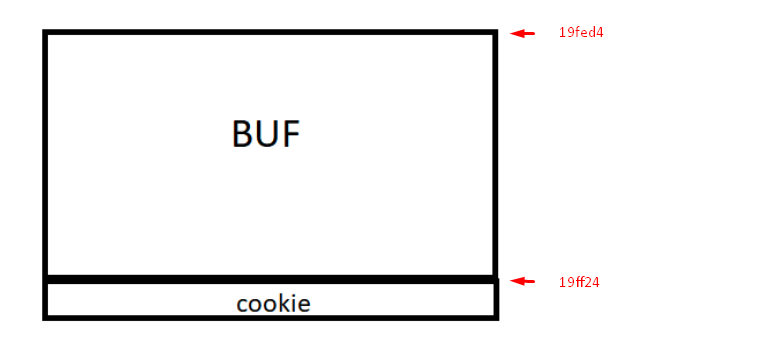
The memory grows from zero upwards. The address of buf is less than the cookie address so it will grow.
And what do the addresses of both variables tell us? In my case they were &buf=0x19fed4 and &cookie= 0x19ff24. Both variables are represented in hexadecimal. In order to differentiate them from the decimal numbers, an 0x has been placed in front of them.
The subtraction can be completed in a Python console or in Pycharm itself:

The buffer size is 80 because cookie starts right where the buffer ends, so the difference gives us the buffer size.
Often, when we do these types of accounts based on the source code, it gives us a bigger size than the one reserved in the original code. The compiler ensures that it will reserve at least 80 bytes. It can reserve more, never less.
The point is that we already know some things about the code, the sizes of the variables and their location thanks to the printf command.
Now let’s see the other place where the variable buf is used because for now it only prints its address but has not been used for saving anything in it.

The gets instruction in red is a keypad entry function, which will enter the amount that the user wants, until he presses the enter key.
There is no way for the program to limit the amount of data entered by the user, nor is there any way to check the data. As it is entered it is copied directly to the buffer buf.
This presents a problem. We said that buf can only store 80 bytes maximum, so if we enter more, we will produce a buffer overflow. Without a way to limit the incoming data, a user could easily write more than 80 bytes, overflowing our tank.
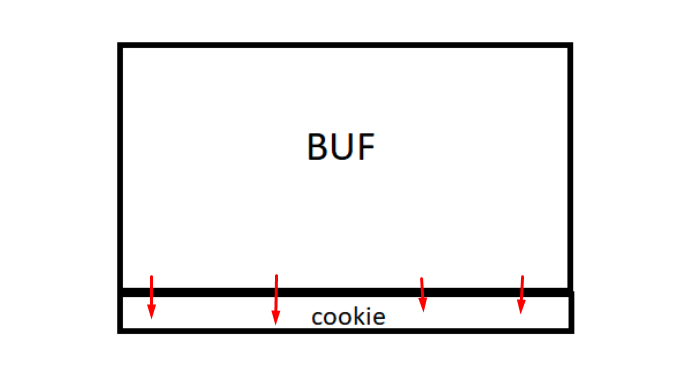
The point is that the cookie variable is under the buf so whatever overflows will step on it and fill it with a value that the user can control.
For example, if the user writes 80 A letters and 4 Bs the 80 As will fill buf and the 4 Bs will fill cookie. When one types a character in the console, at low level it will be saved as its ASCII value.
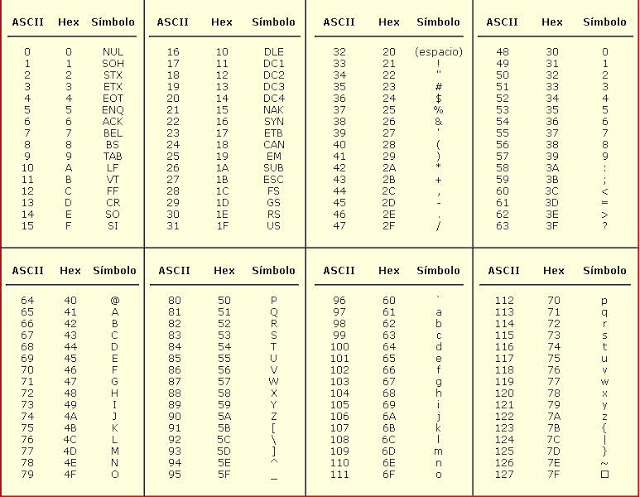
As cookie will have been filled with four B letters that are equivalent to the value 0x42, this means that the value of our cookie will be 0x42424242. In the case of our example, the address of cookie 0x19ff24 will have 0x42424242 as content.

We’ve now seen how to overflow and control the cookie value.

The goal of this exercise is to print “you win.” In order to do that, cookie must be equal to 0x41424344. We can take advantage of the vulnerability of buffer overflow by making the program perform actions different from which it was programmed. This would not be possible without overflow because the value of cookie is never changed in the program code. If there is no overflow, we cannot get the “you win” message.
Instead of passing, for example, 80 As and 4 Bs to print “you win” you should pass 80 As and DCBA because that will save the cookie values ASCII as:
44 43 42 41
Here you can see the format in which the data is stored, in this case little endian, meaning they are stored backwards in the memory.
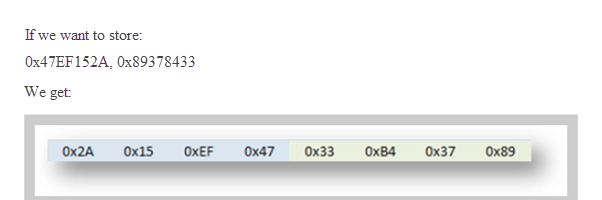
And if 0x41424344 is stored it will be stored in memory as:
44 43 42 41
For that reason, when copying in memory, we must type the value backwards, byte by byte, so that when reading it from memory it does it correctly.
Let’s run the executable in a console:
When the cursor flashes, asking us to type the input data, we’ll carefully type 80 As and then DCBA.
To simplify this, print the string in a Python or Pycharm console. Copy it without quotes and paste it in the console and press enter.
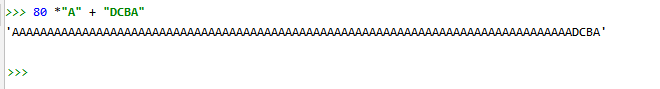
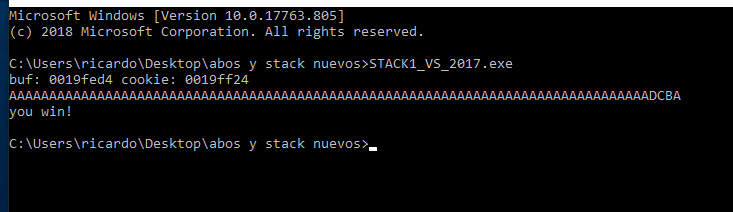
We see that we successfully printed, “you win!”.
We can also see this in a debugger. For the sake of this example, we will use X64DBG.

Choose 32 bits version:

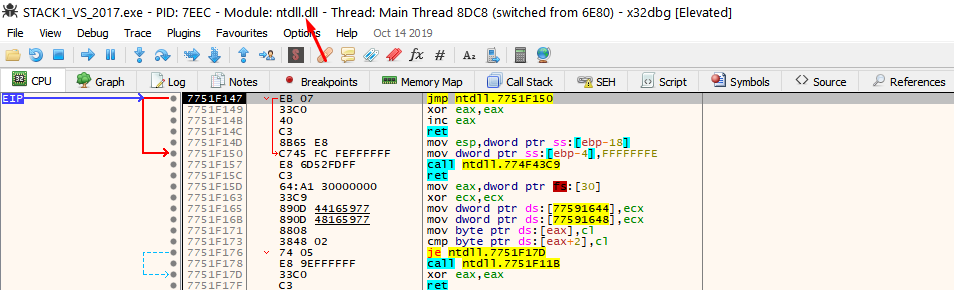
If it stops at ntdll. run it again by pressing F9.
It should stop in the entry point, which is the first instruction of the exercise.
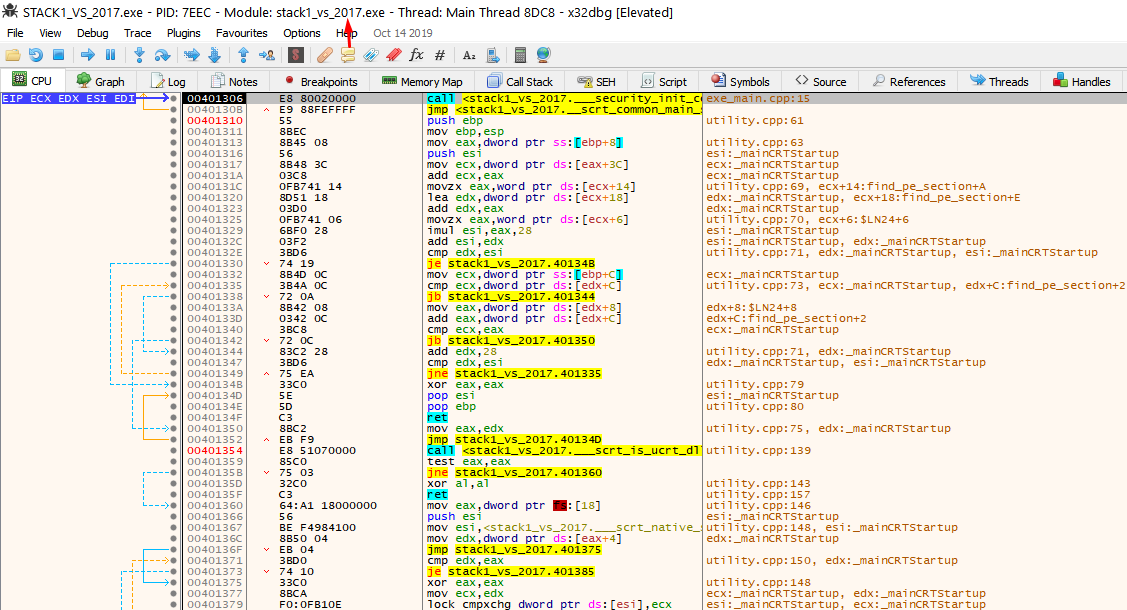
This doesn’t look like the original source code. The compiler adds a lot of code for the executable to work and start correctly. Find the main function to orientate yourself by looking at the strings of the program.
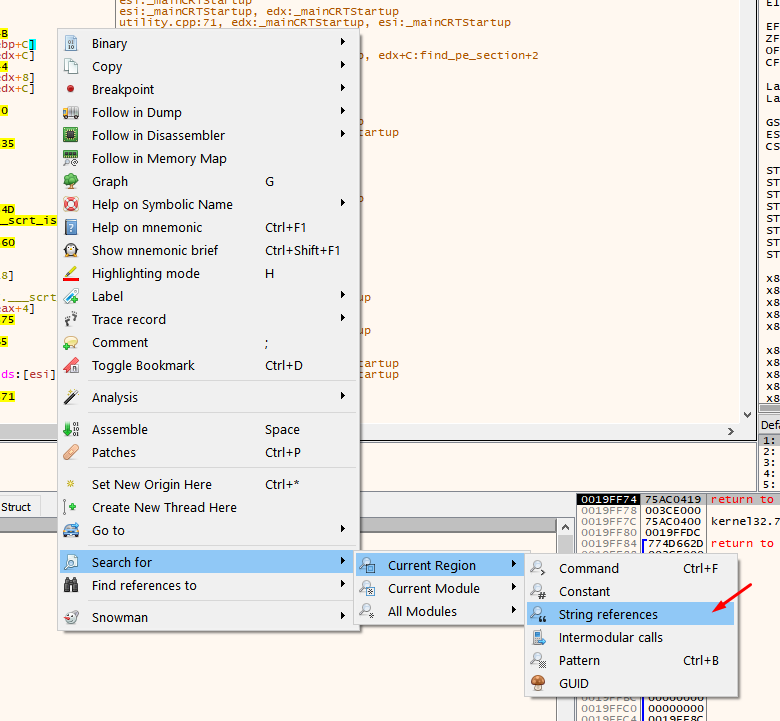
Choose only to search in the current region since they will be in this same section.
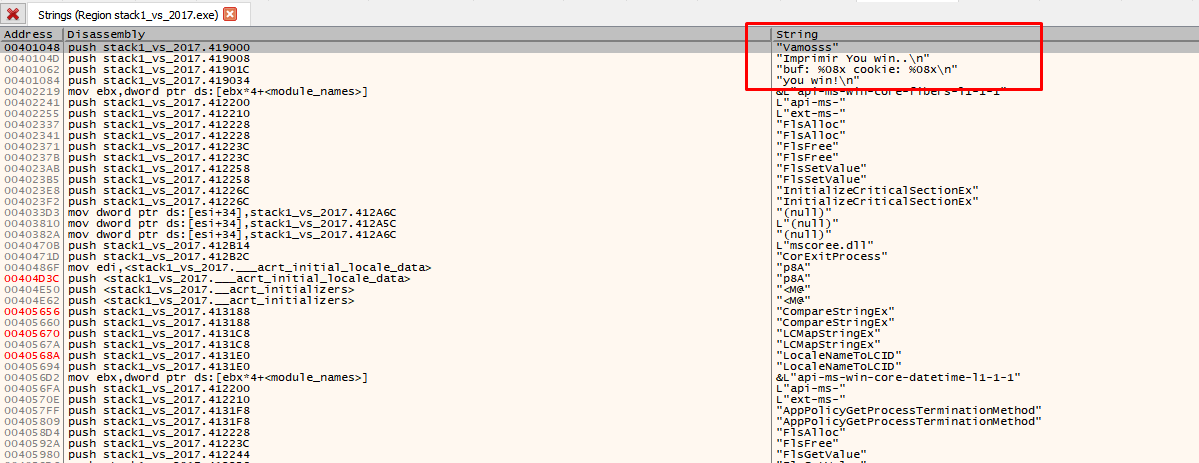
Here are the strings of the program, and others that the compiler added. Double click on some of your strings.

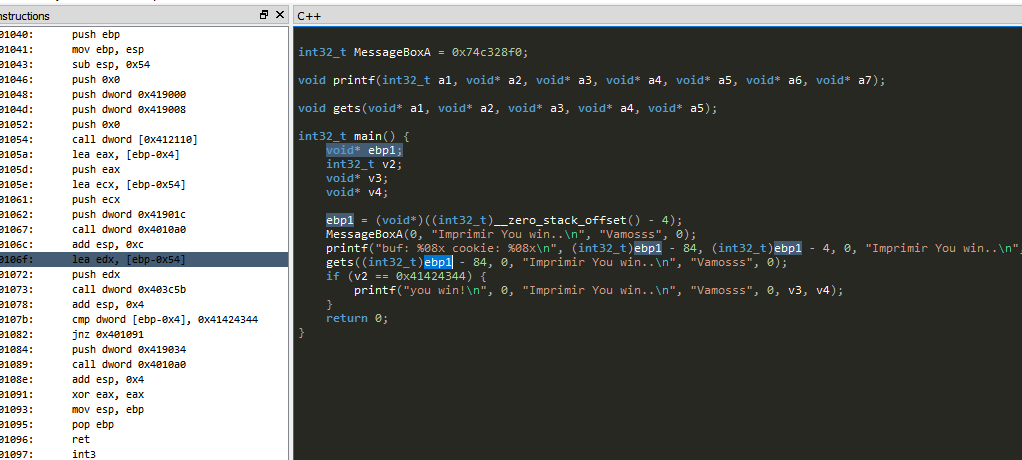
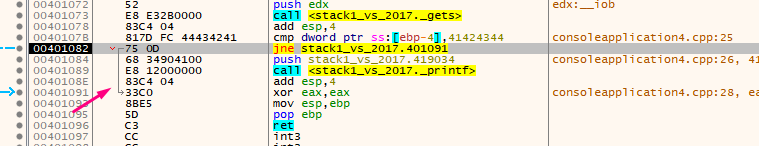
You can now clearly see the call to MessageBoxA, the printf, the gets, and the comparison with 0x41424344.
Add the snowman plugin to decompile and try to see how it tries to get the source code or something as similar as possible from the compiled file.

Put a breakpoint at the beginning of the function and press F9 until it stops there.
In this example, the main function has arguments but are not used within the function.
A function argument is seen below:
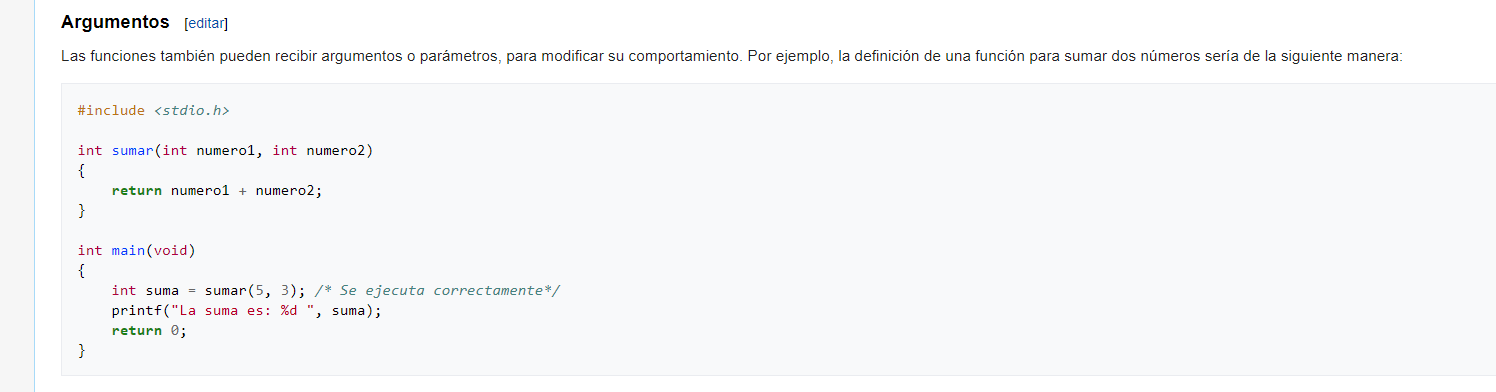

The above two arguments are passed through the stack in 32 bit compiled executables, just before the function call, which means they will be saved in the stack.
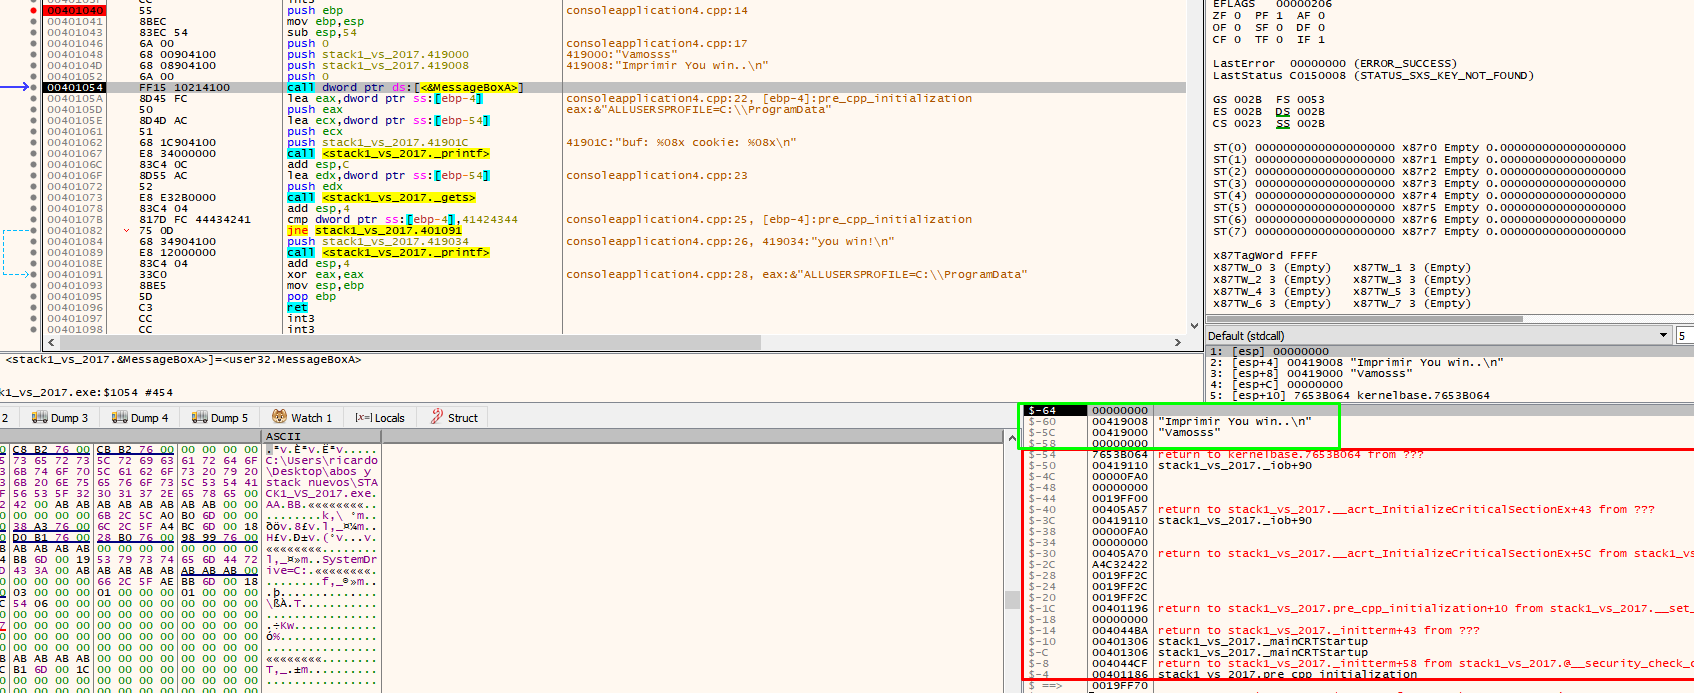
The first value in the stack at the start of a function will be the return address, which is where it will return after it finishes executing the function and its arguments.
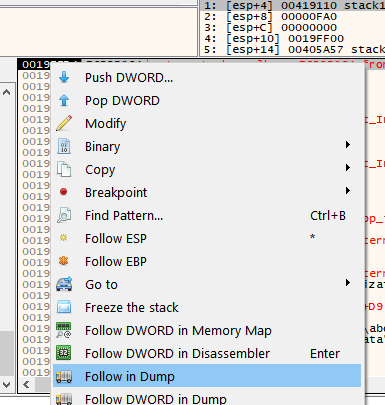
Right click on the return address and choose follow DWORD in disassembler, to see where to return after finishing the function.
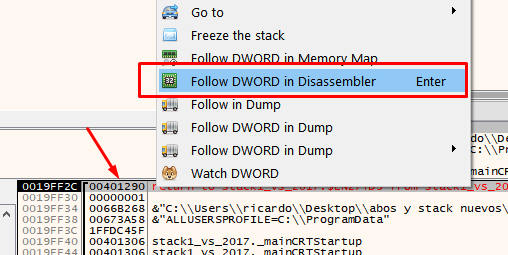
This means that the main function was called from the call that is just above, so you can put a breakpoint there, restart the exercise and verify.

Put a breakpoint there and restart.
This will save the arguments from the main function using those pushes.
As stated above, when entering a function, the first thing that will be in the stack will be the return address (in 32 bits compilation) and below there will be the function’s arguments, first the first argument and successively down the rest.

The second argument is an array of pointers. There are three pointers to the three strings passed as console’s arguments in memory.
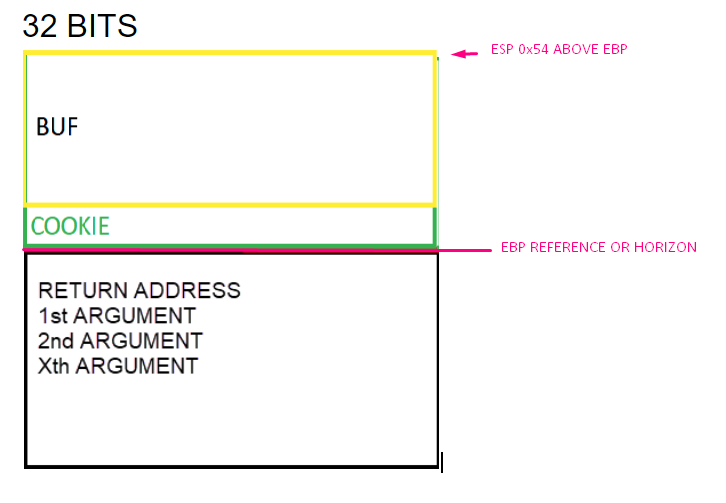
32 BITS
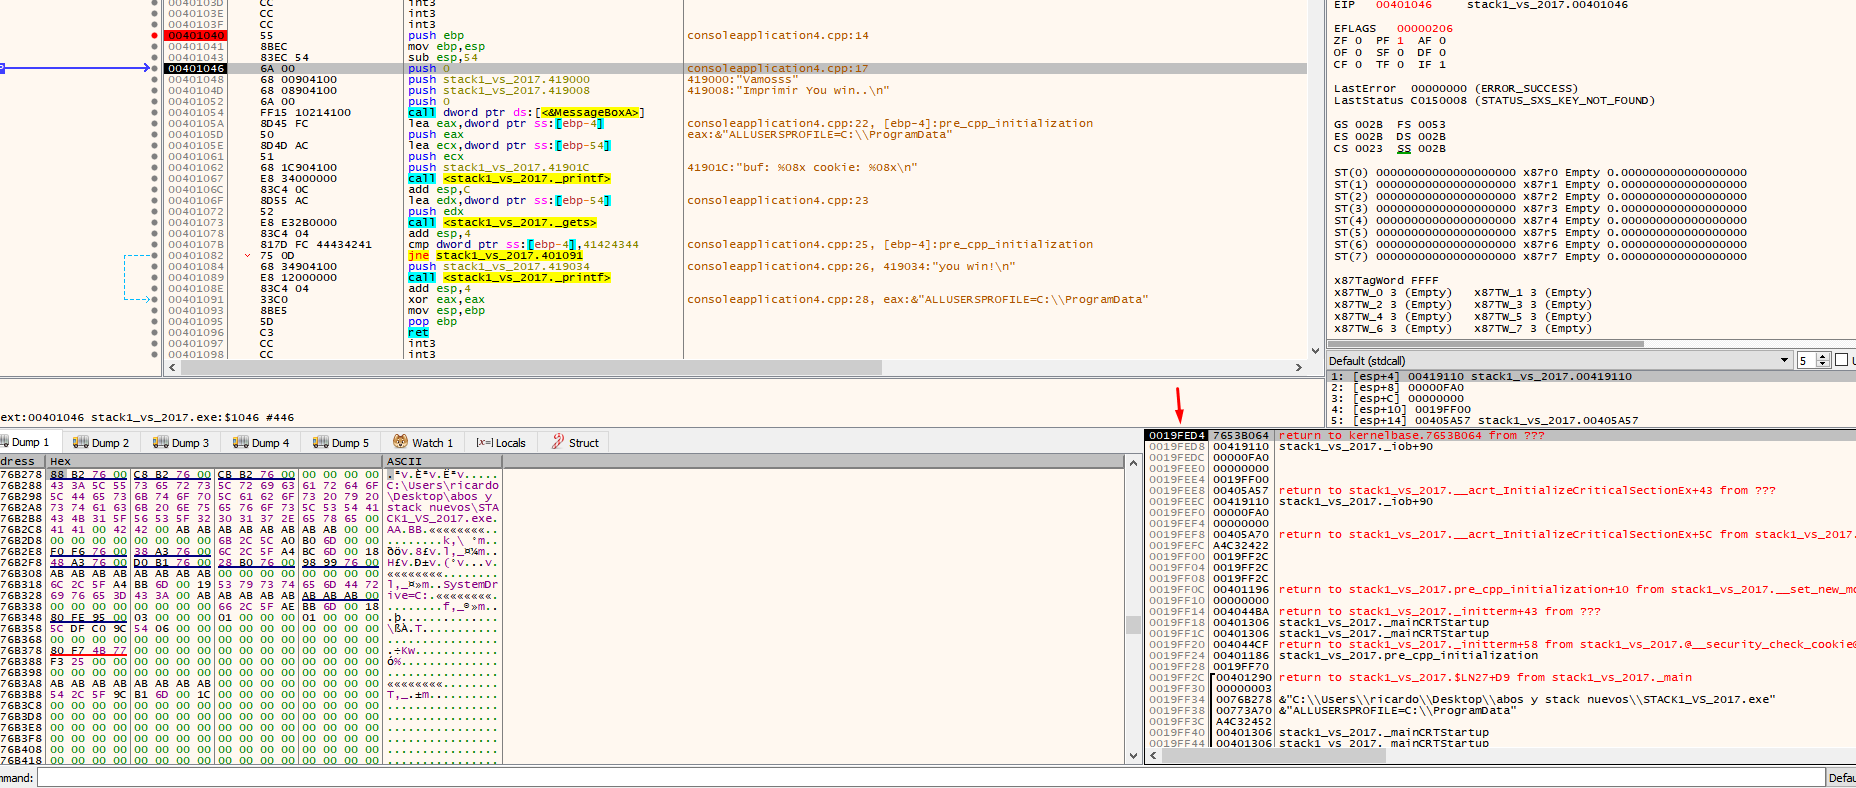
Here is the beginning of the function. Just below there is the return address and the function’s arguments.
This 32-bit compilation is slightly different than the 64-bit compilation, because the function’s arguments are passed in another way that will be discussed later.
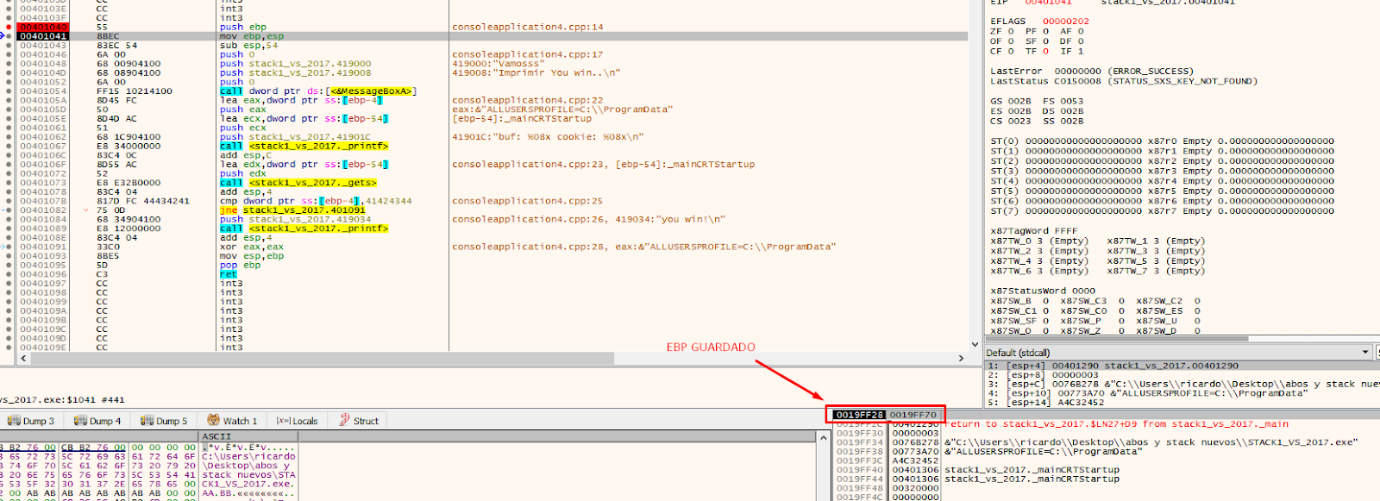
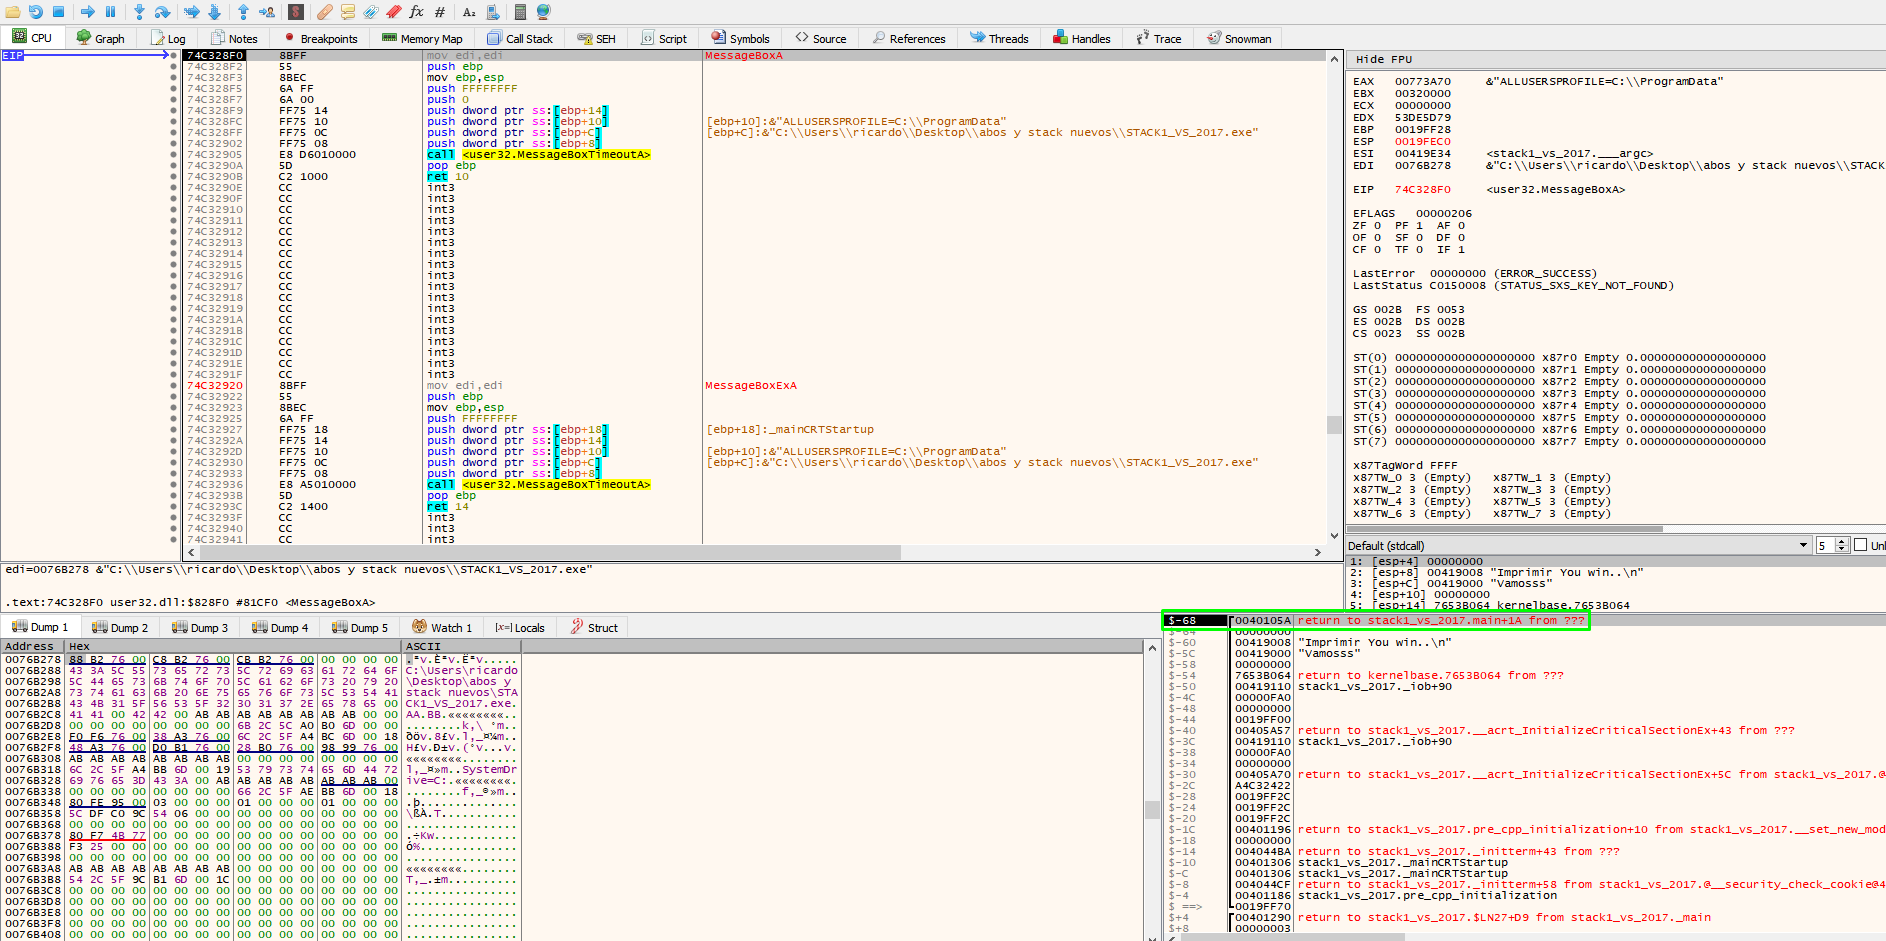
Once the function begins to execute, starting with the prologue, which stores the EBP value of the function that called.
That will cause the stored EBP value to be stored just above the return address.
Execute the instruction by pressing F7.
To see that the stored EBP value is located in the stack just above the return address.
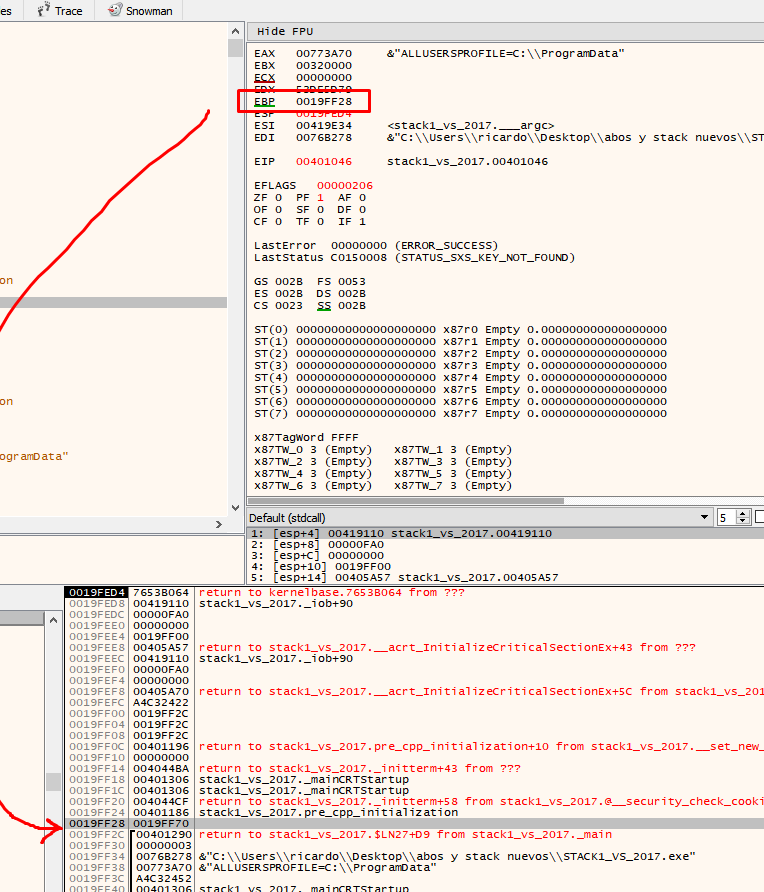
The next prologue instruction is:
This sets the EBP for the current function. The one that was saved (stored EBP) to the address of the parent that called this function. In this example the function is EBP based, in other cases it may differ,
We can create the framework for our current function by putting EBP at the current ESP value.
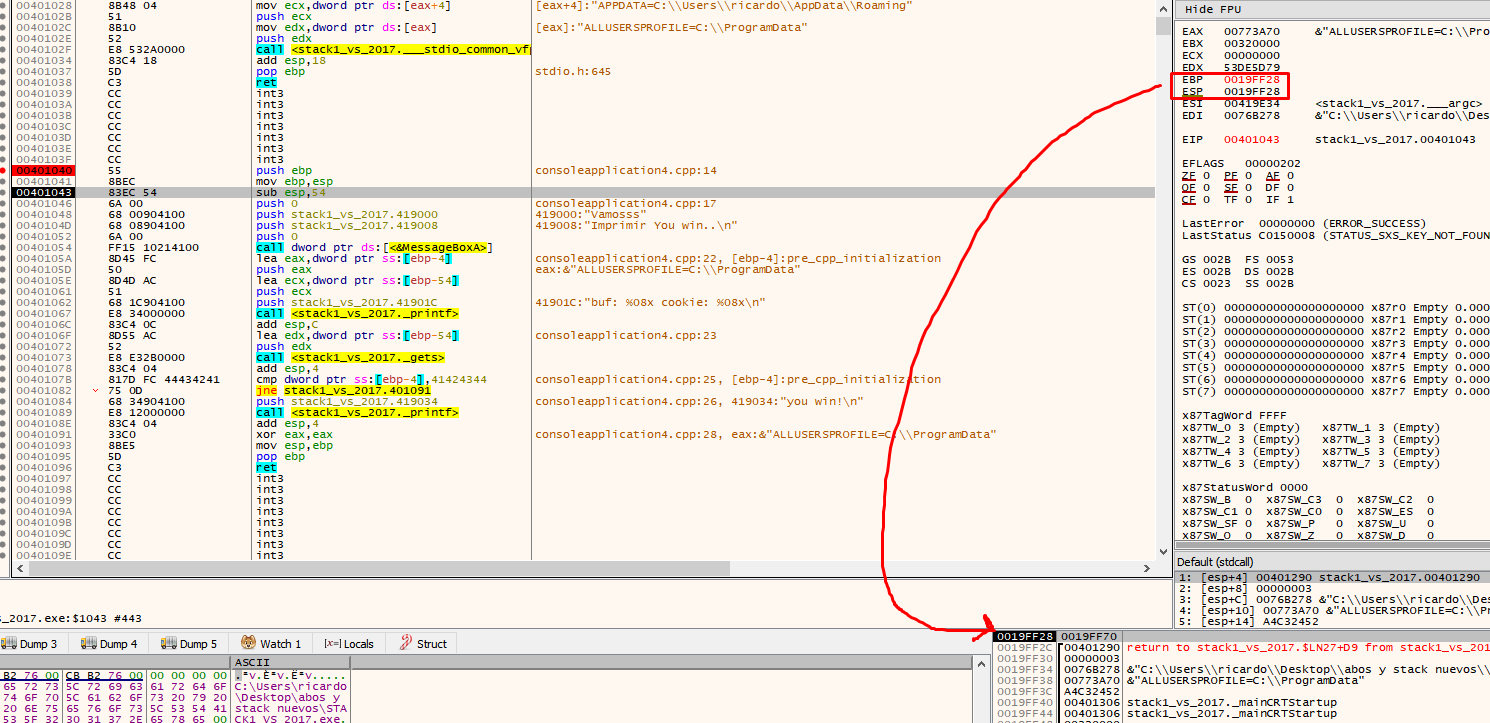
Within the EBP based function, the EBP value will be maintained and be taken as a reference, while ESP will vary.
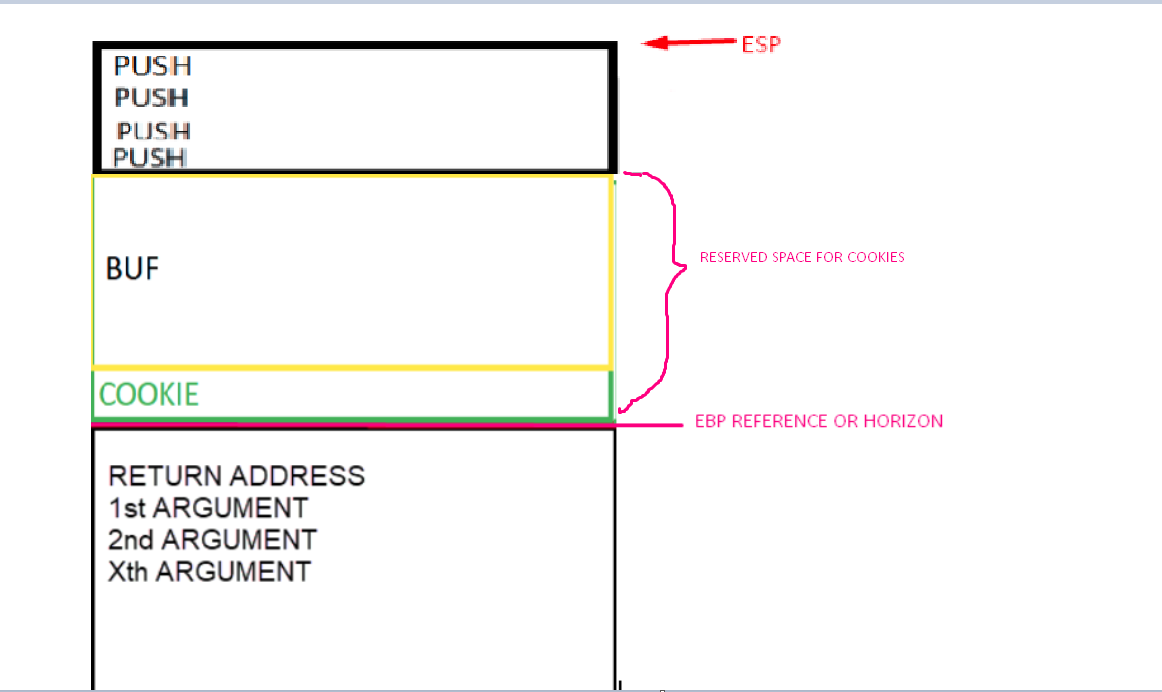
A very important point is that the EBP value is taken as a reference. In the EBP based functions, the variables and arguments can be named by their distance to the address that will be stored in the EBP value until the epilogue is reached. Several variables in the list are marked as EBP-4 or EBP-54, referring to the current EBP value.
Once EBP takes its value after the prologue, it will be like a watershed and the arguments will always be down that direction. The saved ebp and return address are also below but will have no references in the code. So EBP+XXX (something added to EBP), refers to arguments, while the variables will be above this address. So a reference to EBP – XXX (subtracting), refers to some local variable.
In the following applies as a general rule for EBP based functions:
EBP + XXXX = arguments passed to the function
EBP – XXXX = local variables of the function
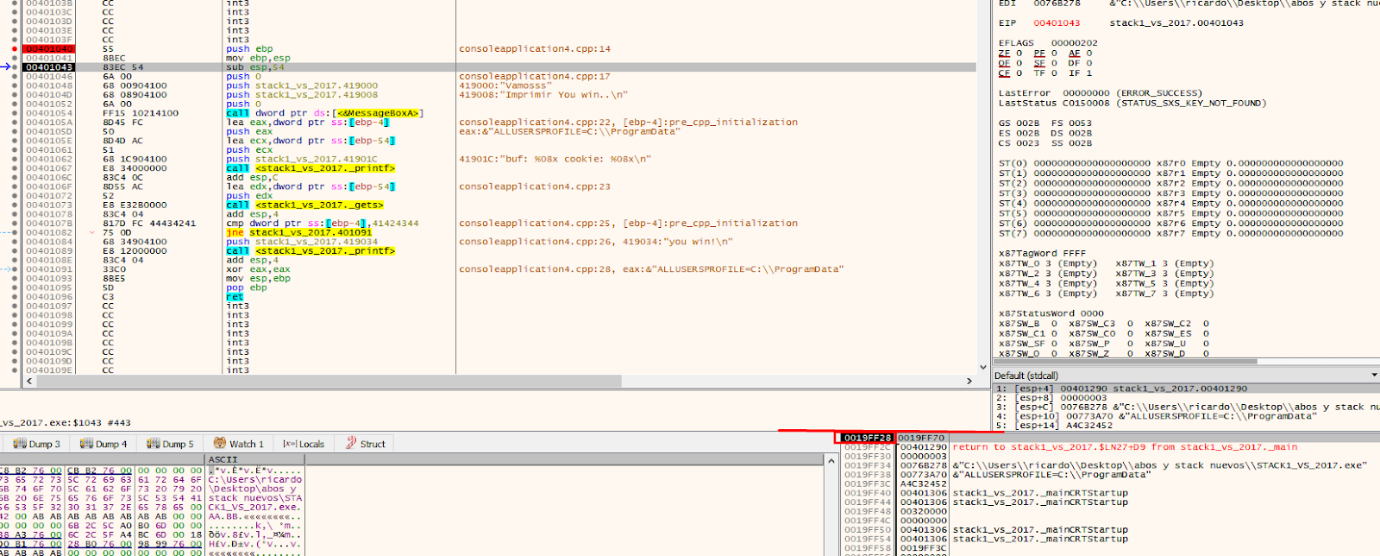
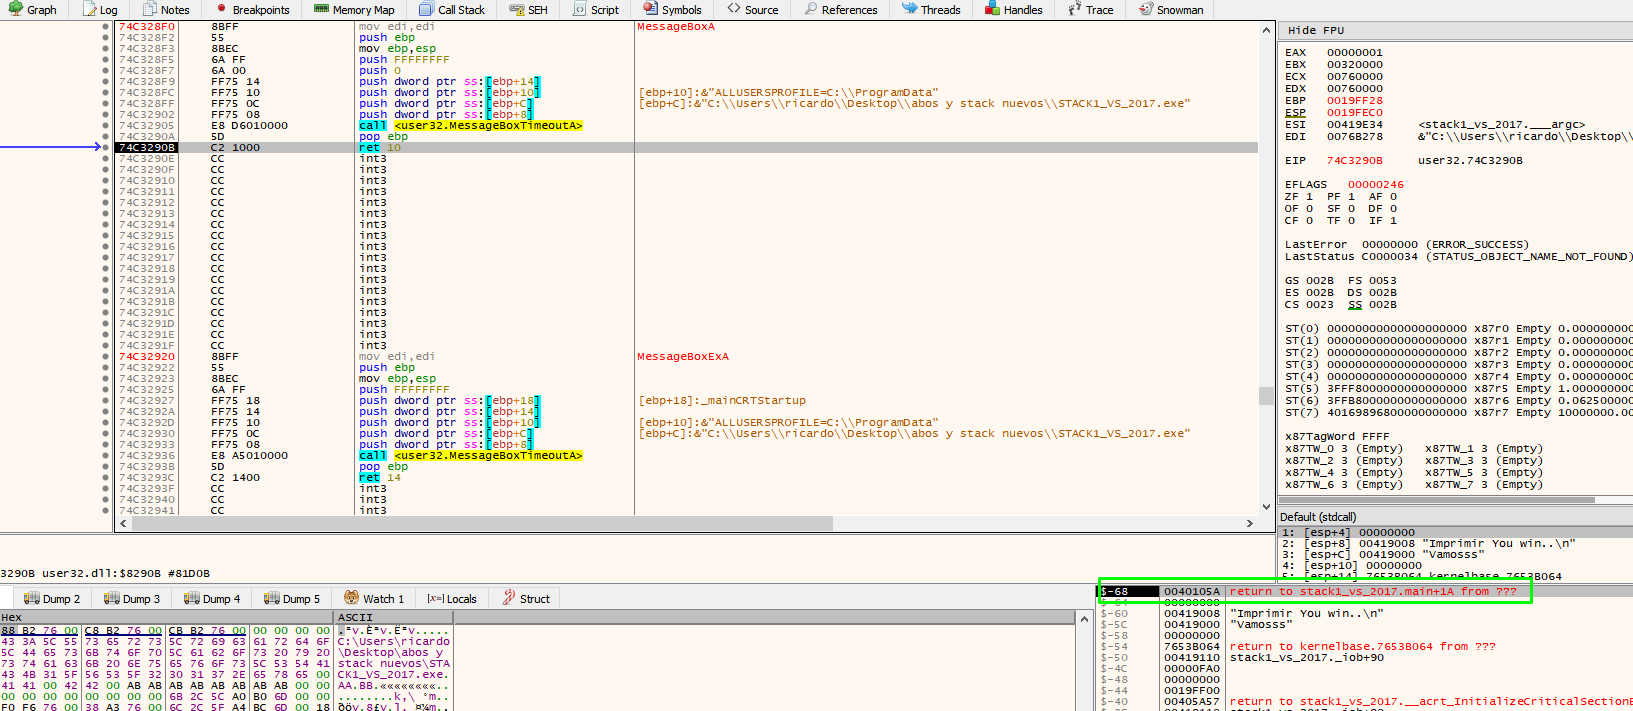
After the prologue, there will be some way to reserve space for the variables. For this example, ESP is moved up so that space left below is reserved for the sum of all the lengths of the variables. Sometimes, a little more space is left, just in case, depending on the compiler.
ESP will be located above EBP, which remains as a reference. Additionally, 0x54 converted to decimal is 84, which is the sum of the length of buf (80) and cookie (4).
Upon executing this instruction, a space will be created for the buf and cookie variables of 84 bytes. Click on the first column on the stack and look at the EBP value, which will be displayed lower in the stack.
Double click to show the values with respect to EBP also in the stack within the first column.

For example, ebp-4 is displayed in the list, in the first column of the stack. It also appears as ebp-4 in the clarification.
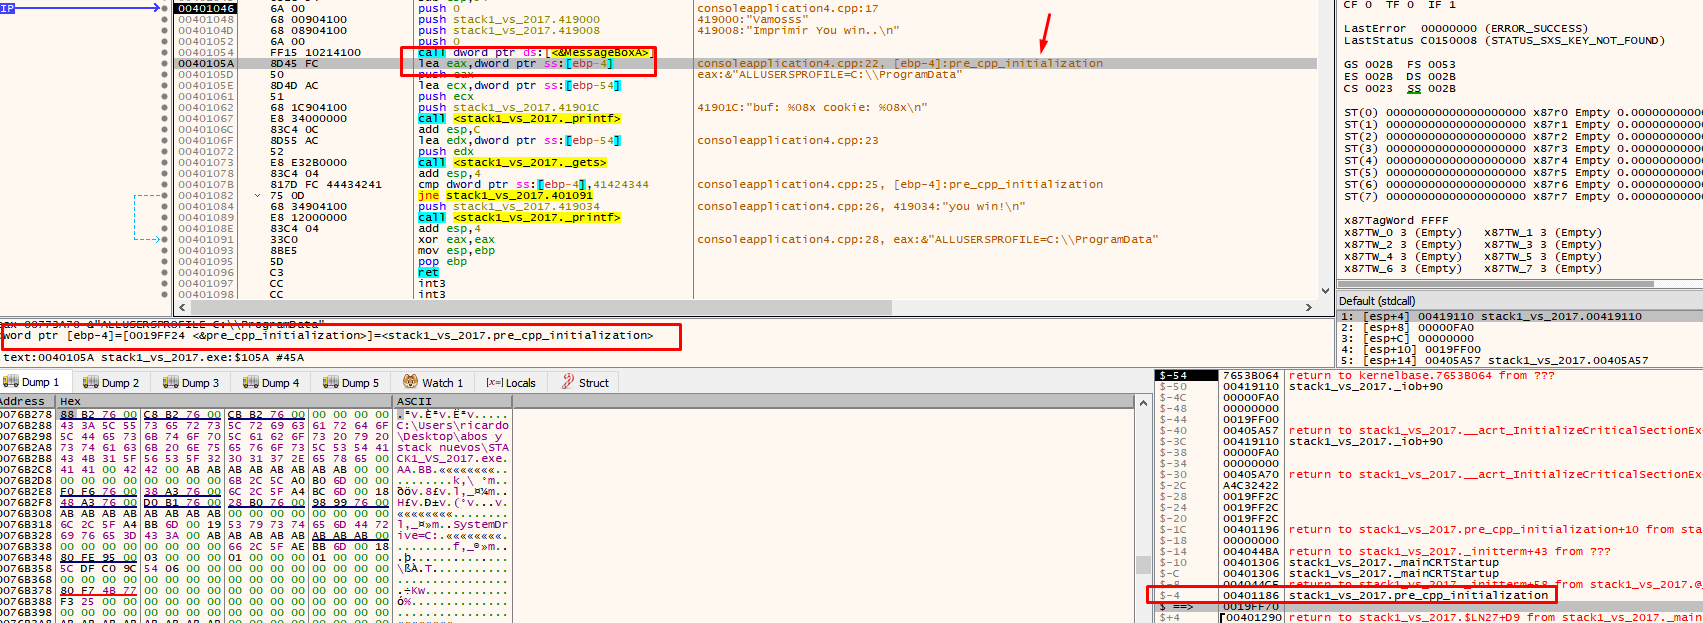
The position where ESP is located to reserve variables will always move up because it must respect the space allocated for the variables. For instance, when making the 4 push for MessageBoxA it places them above the reserved space in the ESP.
Look at the stack below to see the four arguments, marked in green, that were added above the reserved space, which is marked in red.
When entering MessageBoxA, the return address of that function is stored on the stack.
Press F8 in MessageBoxA to find the return address of thr function.
Return just below the function call to MessageBoxA.
The “push”ed values saved for MessageBoxA and the return address of that function are ib use. The value of ESP is just above the reserved area as it was before calling any function. The call to printf will save the original function’s parameters with push and the return address. The ESP address will increase but when leaving the function it will lower again just above the reserved area.
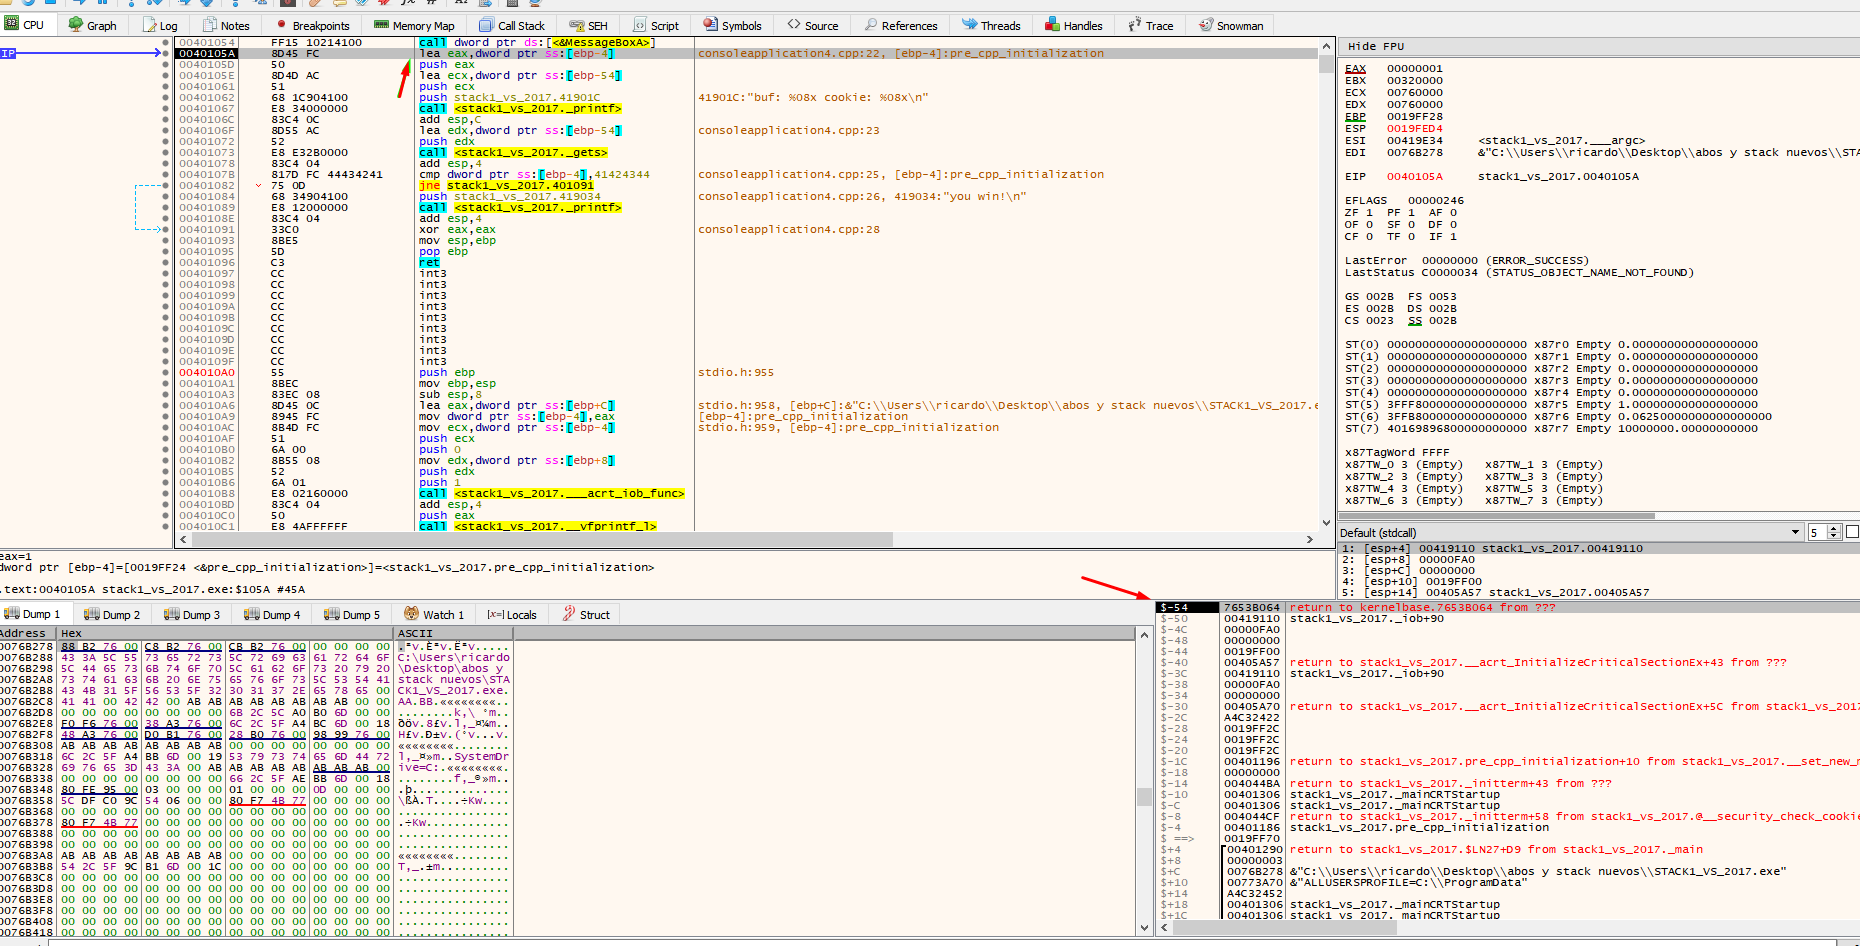
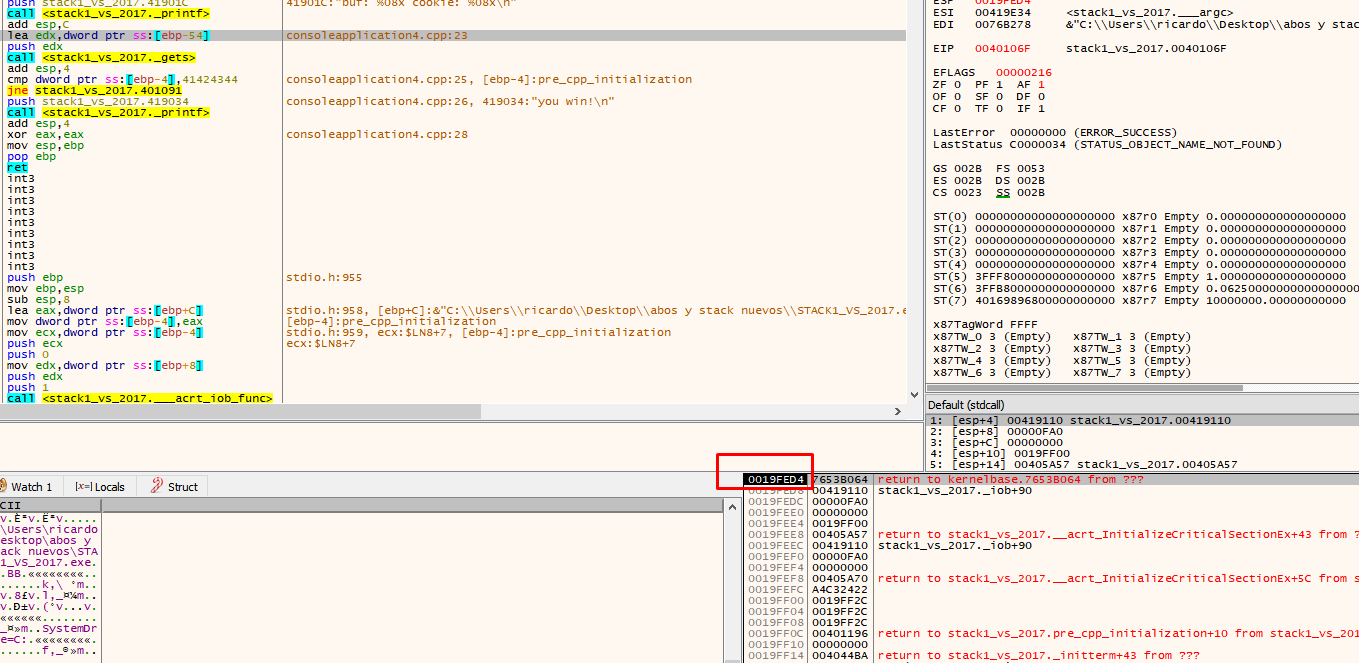
Once you pass over the printf, the buf and cookie addresses are printed.
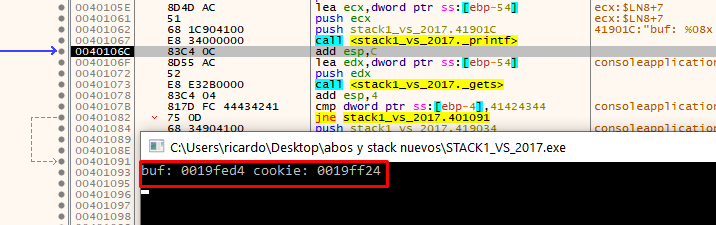
Addresses vary depending on the machine and set up. For instance, in the above example, the address of buf is 19fed4 and the address of cookie is 19ff24.
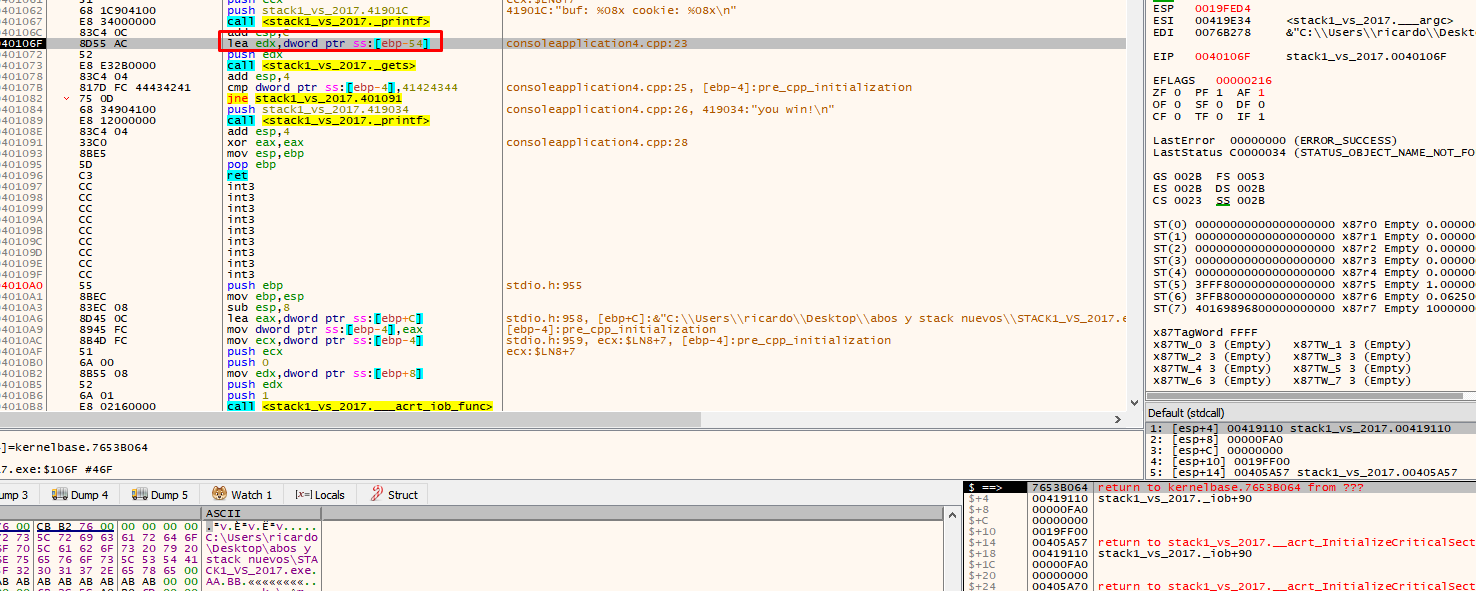
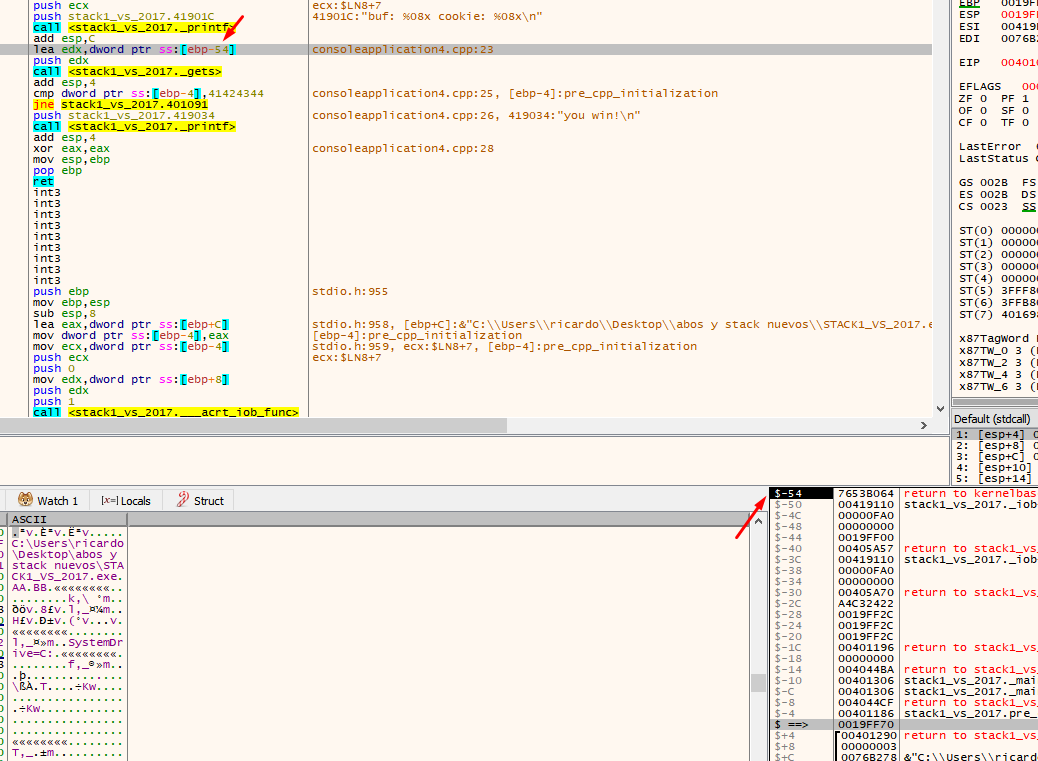
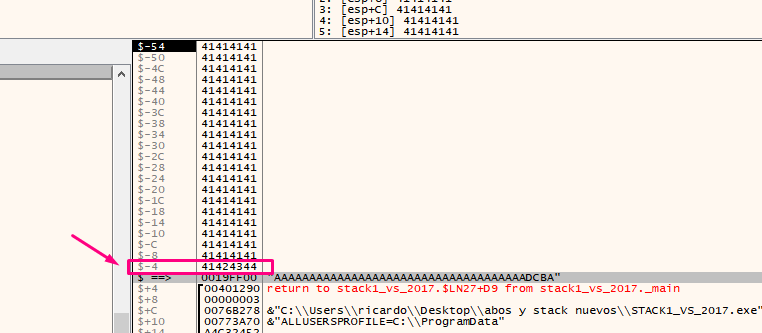
There we see that the application uses EBP-54. This is the address of our buf (19fed4 in this example). When you double click on the stack, the debugger will show the address as $-54.
See how bytes are saved elsewhere by placing the address where data is saved in the dump.
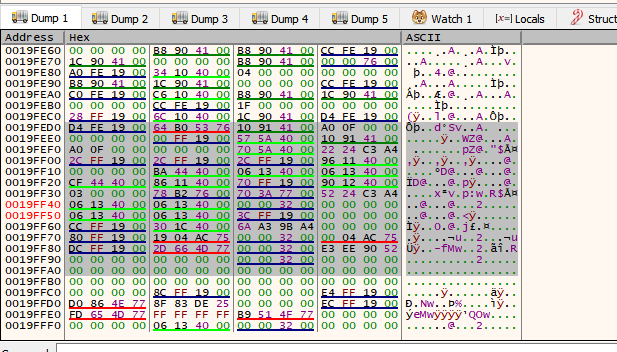
There it is, more up it’s not displayed because there is no more data below.
When you press F8 on the console, type the data you want to send and press enter. This will fill the buffer, as well as the cookie value.
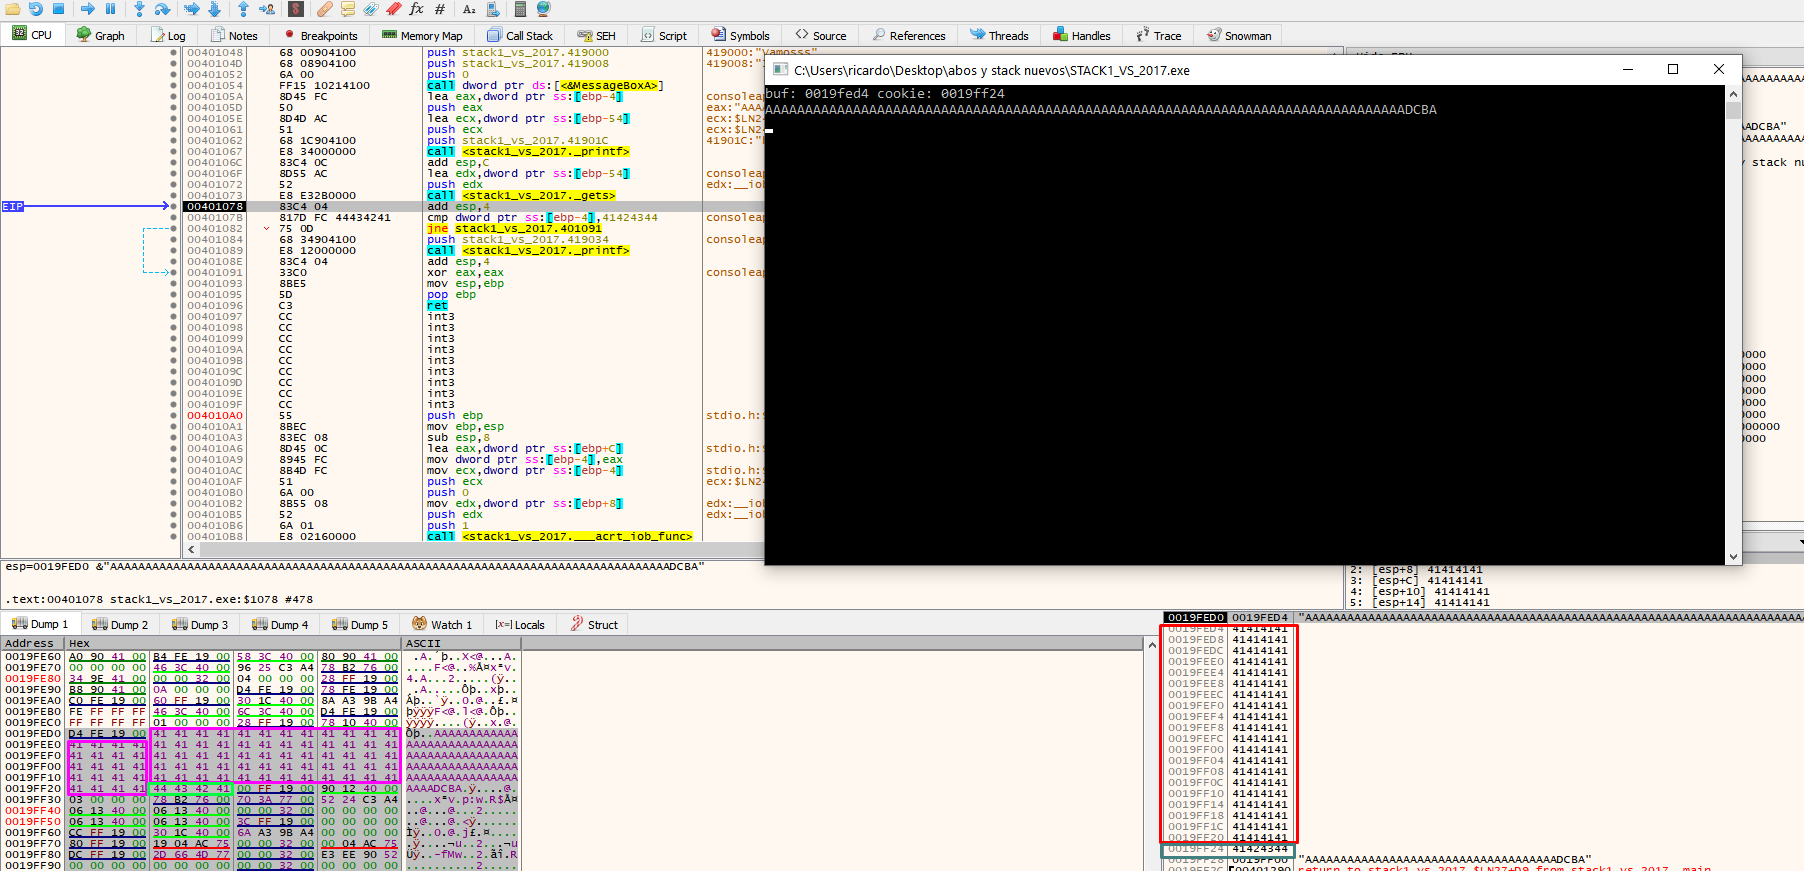
In the above example, the cookie was at address 19ff24.
Next, we can compare the cookie with the address 0x41424344.
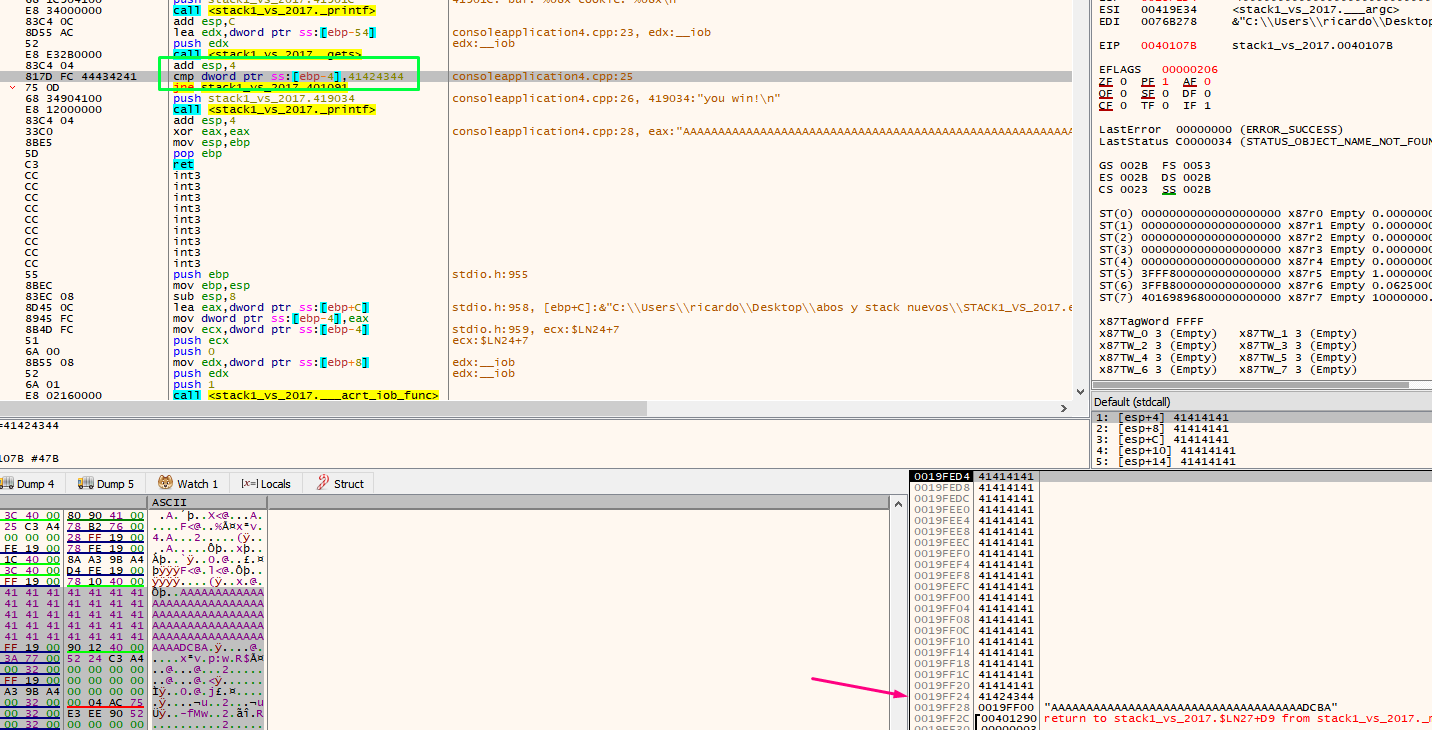
We see that EBP-4 says that it is a cookie, in addition to the address if we reset the HORIZON to the value of EBP as before.
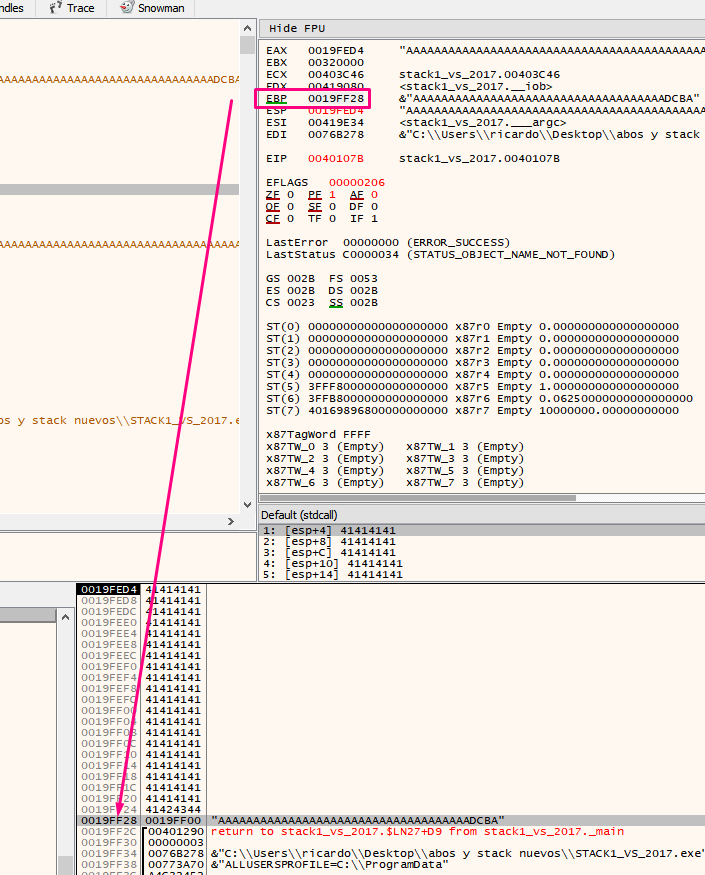
Double click to see that EBP-4 is a cookie since it is in the -4 of the stack by zeroing the HORIZON.
The program will not jump and produces our desired output of ”you win!”
We have now both achieved the objective manually and dynamically analyzed stack1, using the X64dbg debugger. This debugger does not allow us to analyze an application without running it through the program. In order to conduct a static analysis, we must use other tools such as IDA PRO, GHIDRA or RADARE.
Next, make a script model to exploit the exercise from Python.

If using Python 3, place the parentheses in the print command and be careful when adding strings that must be bytes. Place a ‘b’ in front of strings that originated in Python 2).
I notice that the path is correct and when running it.
With a Python 3 script model ready to exploit stack1, you’re ready to move on to part three, where we will continue with static analysis of this exercise using IDA, RADARE and GHIDRA.
In addition to stack1 there is also stack2, stack3 and stack4, which can be solved as supplementary exercises.
In part three, we will see IDA FREE, RADARE, and GHIDRA.
In part one of this series, we focused on installing several tools that will be useful for reversing and exploiting security weaknesses on Windows. These tools are free to access, so anyone can use them to learn and try out the useful exercises that this article series will provide.
Before going into the exercises, let’s list and define some important concepts.
Bug: A bug is the result of a failure or deficiency during the process of creating computer programs (software). Such a failure can occur at any stage of the software’s life cycle, although the most obvious ones occur at the development and programming stage.
Vulnerability: Vulnerabilities are a subset of bugs. A vulnerability is a certain type of bug in a piece of software that allows, through exploitation, the security of a computer system to be compromised.
Vulnerabilities allow threat actors to perform actions for which the software was not intended and abuse them.
While there are many types of vulnerabilities, we are going to focus on studying Windows exploits, and their exploitation techniques.
Exploit: An exploit is software code that tries to use a vulnerability of other software.
The goal of the exploit could be malicious, such as destroying or disabling the attacked system.
More typically, exploits are used to violate security measures in order to be able to gain unauthorized access to information and use it for one’s own benefit or as a source of other attacks on third parties.
Threat actors can exploit a vulnerability to crash an application or even the whole system. They can also execute code on local or remote machines. Difficulty varies depending on the vulnerability, the environment, and the mitigations that the target has at the moment of exploitation.
Buffer Overflow
The first type of vulnerability we are going to study will be the buffer overflow, starting with the simplest example, building techniques step by step as we increase in difficulty. A buffer is a memory space of a certain size reserved for storing and managing data. A buffer overflow occurs when a computer program exceeds the amount of memory reserved for it by writing to the contiguous memory block.
Think of an empty 20 liter tank. You can store no more than 20 liters of liquid. If you want to store more in a single tank you need to find a larger buffer. Otherwise, when trying to store, say, 40 liters in that 20 liter tank, the liquid will overflow. This overflowing is the buffer overflow, or the overflow of the tank that exceeds the maximum capacity of it.
For instance, this can occur when a computer application doesn’t have the necessary security checks in its programming code, like measuring the amount of data that will be copied into a buffer ensuring that it does not exceed its size.
The most common types of buffer overflows are stack buffer overflows and heap buffer overflows.
A stack is used to store local variables of a function that are only needed while the function is executing. In most programming languages it is fundamental that we know a variable size for compile time if we want to store it in the stack.
The heap is used to reserve dynamic memory, whose need is not known in advance, but is expected to last a while. If we do not know a function’s size or it’s decided at runtime, it should be reserved in the heap.
It is also used for objects that vary in size, because we do not know at compile time how long they will last or what they will cover.
At Core Security, we often challenge new employees to solve the stacks and abos problem of one of our original founders, Gerardo Richarte. Challenge yourself to the stack exercises below.
Stack Exploitation Exercises
We will start step by step with the stacks that are the simplest, compiled with minimal protection to make it easier to start exploitation.
Let’s see the source code of stack1.
https://drive.google.com/open?id=16btJAetpa1V5yHDZE2bnnFWTQNpsUR4H
Here we have the exercises folder and inside it is the source code of the stack1 called STACK1_VS_2017.cpp.
Let’s try to understand this code and see where the buffer overflow can be produced, and if it will be an overflow buffer in the stack or in the heap.
A call to MessageBoxA that will show us a text that encourages us to solve it has been added to the code of the original stack1. It is just an addition that does not influence anything but is a standard call to Windows function that we will not analyze here.
We know that within a function, if there are local variables you must reserve space for them before starting with the instructions themselves.
Below is some original code, created by Gerado Richarte:
The first part, in red, reserves the space for local variables. In this case there are two local variables, cookie and buf.
You can find them in the table of data types.
In the case of buf, we see that it is an array or string of char so as a char it has one-byte size.
As an array, it has 80 chars, with 80 bytes length.
Creating an array can store many values of the same type of data. Begin with what type the data is and how many there will be.
In the first example, there is an array of100 ints. Since one int occupies four bytes, the total length would be 100 x 4= 400 bytes.
In the second example, one float occupies four bytes, so it would be an array of five floats. The final size would be 5 x 4 = 20 bytes.
When we analyze an array at a low level, we see that it is a reserved memory space or buffer, but it is not the only way to reserve space. There are other types of data variables that also require reserved space in the memory that will need buffers to keep its content.
Returning to our exercise:
This is a char array of 80 x 1 = 80 bytes long. Like our tank of 20 liters, if we try to keep more than 80 bytes it will overflow.
Next, we’ll discuss how the buffer or variable char array called buf (indicated below with red arrows) is used.
In the first instruction there is a printf that is used to show the string between the quotes as a console message
But printf not only prints the quoted string but also prints with formatting. The percentage characters inside tell us that it will form an output string. The string is just the first argument of the function and is in the output format. There can be several other arguments–one for each %.
in this case, there are two %x. Next, we’ll check the table of field types for printf.
We see that it will take those integers (int) and insert them into the output string with base16–hexadecimal. The 08 refers to the fact that if the number has less than 8 digits it will be filled with spaces.
This example is filled with spaces before the number, so there are several modifiers to change the output, referred to as format specifiers.
In our case, our format specifier was [width].
The result is not truncated, but instead only fills in with spaces if the length of the argument to insert is less than the value in front of the x.
Therefore, we know that it prints two hexadecimal numbers that come from the two arguments.
We know that a variable has a memory address and a value to store. Like our 20-liter tank, it has its contents or value, which are the amount of liters it stores inside. But if I have a garage full of similar tanks, I need to have some way of knowing where the tank I want is located out of all the tanks I own.
This is indicated by the & (ampersand symbol), which tells us the direction or location of the tank, but not its contents or value. The ampersand is used to indicate the memory address of the variable where the data will be stored.
For instance, if I run the executable on a console I’ll see:
The above is merely one possible example. The output will vary depending on your environment.
The memory grows from zero upwards. The address of buf is less than the cookie address so it will grow.
And what do the addresses of both variables tell us? In my case they were &buf=0x19fed4 and &cookie= 0x19ff24. Both variables are represented in hexadecimal. In order to differentiate them from the decimal numbers, an 0x has been placed in front of them.
The subtraction can be completed in a Python console or in Pycharm itself:
The buffer size is 80 because cookie starts right where the buffer ends, so the difference gives us the buffer size.
Often, when we do these types of accounts based on the source code, it gives us a bigger size than the one reserved in the original code. The compiler ensures that it will reserve at least 80 bytes. It can reserve more, never less.
The point is that we already know some things about the code, the sizes of the variables and their location thanks to the printf command.
Now let’s see the other place where the variable buf is used because for now it only prints its address but has not been used for saving anything in it.
The gets instruction in red is a keypad entry function, which will enter the amount that the user wants, until he presses the enter key.
There is no way for the program to limit the amount of data entered by the user, nor is there any way to check the data. As it is entered it is copied directly to the buffer buf.
This presents a problem. We said that buf can only store 80 bytes maximum, so if we enter more, we will produce a buffer overflow. Without a way to limit the incoming data, a user could easily write more than 80 bytes, overflowing our tank.
The point is that the cookie variable is under the buf so whatever overflows will step on it and fill it with a value that the user can control.
For example, if the user writes 80 A letters and 4 Bs the 80 As will fill buf and the 4 Bs will fill cookie. When one types a character in the console, at low level it will be saved as its ASCII value.
As cookie will have been filled with four B letters that are equivalent to the value 0x42, this means that the value of our cookie will be 0x42424242. In the case of our example, the address of cookie 0x19ff24 will have 0x42424242 as content.
We’ve now seen how to overflow and control the cookie value.
The goal of this exercise is to print “you win.” In order to do that, cookie must be equal to 0x41424344. We can take advantage of the vulnerability of buffer overflow by making the program perform actions different from which it was programmed. This would not be possible without overflow because the value of cookie is never changed in the program code. If there is no overflow, we cannot get the “you win” message.
Instead of passing, for example, 80 As and 4 Bs to print “you win” you should pass 80 As and DCBA because that will save the cookie values ASCII as:
44 43 42 41
Here you can see the format in which the data is stored, in this case little endian, meaning they are stored backwards in the memory.
And if 0x41424344 is stored it will be stored in memory as:
44 43 42 41
For that reason, when copying in memory, we must type the value backwards, byte by byte, so that when reading it from memory it does it correctly.
Let’s run the executable in a console:
When the cursor flashes, asking us to type the input data, we’ll carefully type 80 As and then DCBA.
To simplify this, print the string in a Python or Pycharm console. Copy it without quotes and paste it in the console and press enter.
We see that we successfully printed, “you win!”.
We can also see this in a debugger. For the sake of this example, we will use X64DBG.
Choose 32 bits version:
If it stops at ntdll. run it again by pressing F9.
It should stop in the entry point, which is the first instruction of the exercise.
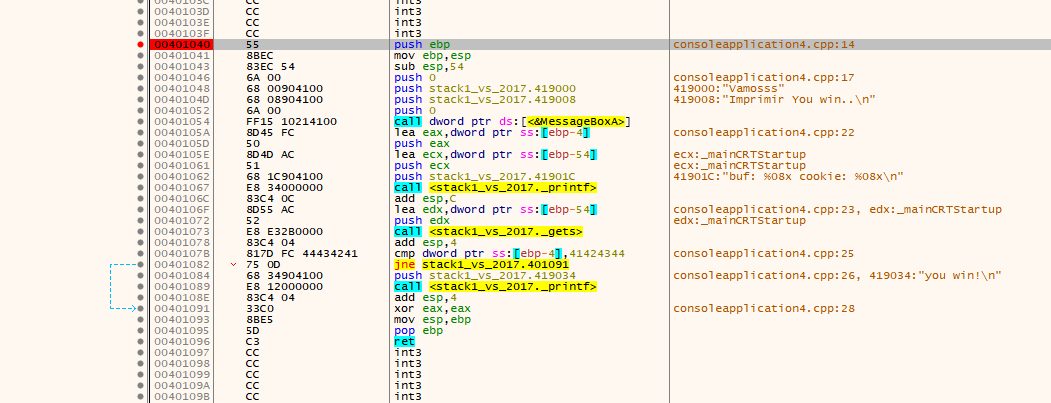
This doesn’t look like the original source code. The compiler adds a lot of code for the executable to work and start correctly. Find the main function to orientate yourself by looking at the strings of the program.
Choose only to search in the current region since they will be in this same section.
Here are the strings of the program, and others that the compiler added. Double click on some of your strings.
You can now clearly see the call to MessageBoxA, the printf, the gets, and the comparison with 0x41424344.
Add the snowman plugin to decompile and try to see how it tries to get the source code or something as similar as possible from the compiled file.
Put a breakpoint at the beginning of the function and press F9 until it stops there.
In this example, the main function has arguments but are not used within the function.
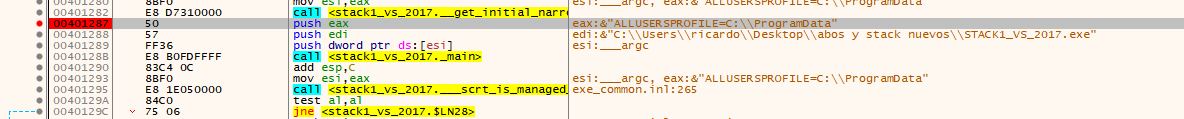
A function argument is seen below:
The above two arguments are passed through the stack in 32 bit compiled executables, just before the function call, which means they will be saved in the stack.
The first value in the stack at the start of a function will be the return address, which is where it will return after it finishes executing the function and its arguments.
Right click on the return address and choose follow DWORD in disassembler, to see where to return after finishing the function.
This means that the main function was called from the call that is just above, so you can put a breakpoint there, restart the exercise and verify.
Put a breakpoint there and restart.
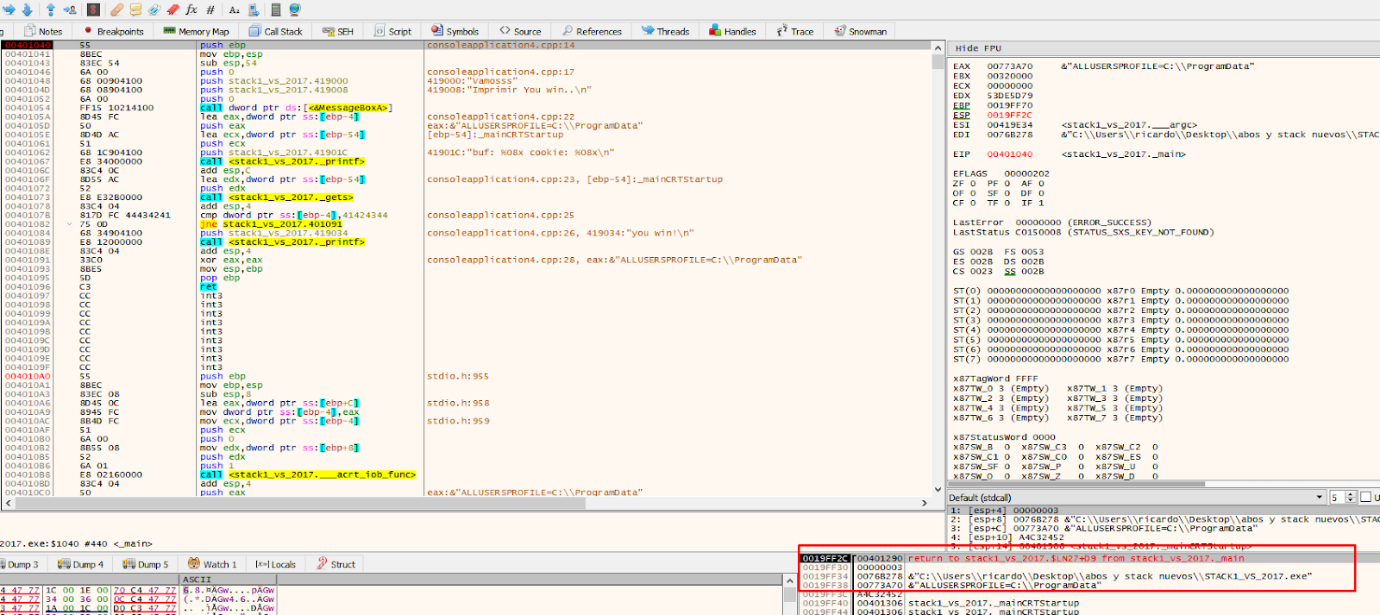
This will save the arguments from the main function using those pushes.
As stated above, when entering a function, the first thing that will be in the stack will be the return address (in 32 bits compilation) and below there will be the function’s arguments, first the first argument and successively down the rest.
The second argument is an array of pointers. There are three pointers to the three strings passed as console’s arguments in memory.
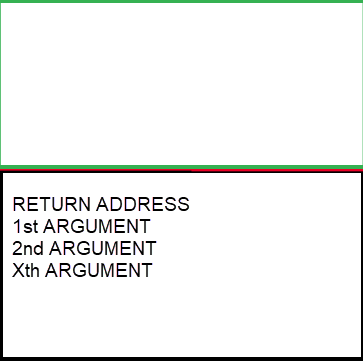
32 BITS
Here is the beginning of the function. Just below there is the return address and the function’s arguments.
This 32-bit compilation is slightly different than the 64-bit compilation, because the function’s arguments are passed in another way that will be discussed later.
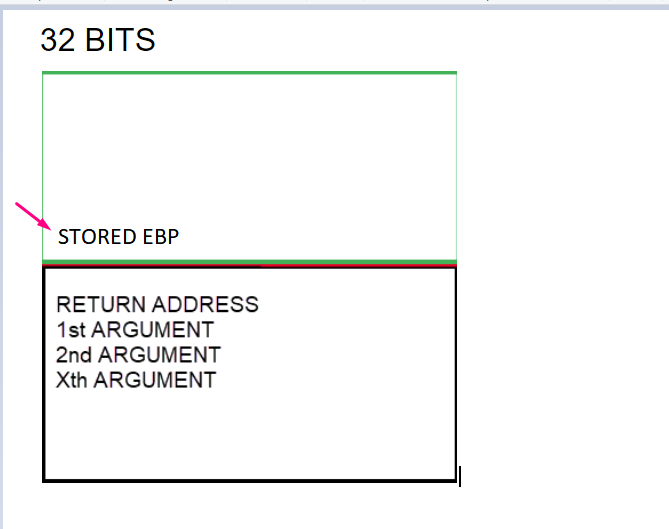
Once the function begins to execute, starting with the prologue, which stores the EBP value of the function that called.
That will cause the stored EBP value to be stored just above the return address.
Execute the instruction by pressing F7.
To see that the stored EBP value is located in the stack just above the return address.
The next prologue instruction is:
This sets the EBP for the current function. The one that was saved (stored EBP) to the address of the parent that called this function. In this example the function is EBP based, in other cases it may differ,
We can create the framework for our current function by putting EBP at the current ESP value.
Within the EBP based function, the EBP value will be maintained and be taken as a reference, while ESP will vary.
A very important point is that the EBP value is taken as a reference. In the EBP based functions, the variables and arguments can be named by their distance to the address that will be stored in the EBP value until the epilogue is reached. Several variables in the list are marked as EBP-4 or EBP-54, referring to the current EBP value.
Once EBP takes its value after the prologue, it will be like a watershed and the arguments will always be down that direction. The saved ebp and return address are also below but will have no references in the code. So EBP+XXX (something added to EBP), refers to arguments, while the variables will be above this address. So a reference to EBP – XXX (subtracting), refers to some local variable.
In the following applies as a general rule for EBP based functions:
EBP + XXXX = arguments passed to the function
EBP – XXXX = local variables of the function
After the prologue, there will be some way to reserve space for the variables. For this example, ESP is moved up so that space left below is reserved for the sum of all the lengths of the variables. Sometimes, a little more space is left, just in case, depending on the compiler.
ESP will be located above EBP, which remains as a reference. Additionally, 0x54 converted to decimal is 84, which is the sum of the length of buf (80) and cookie (4).
Upon executing this instruction, a space will be created for the buf and cookie variables of 84 bytes. Click on the first column on the stack and look at the EBP value, which will be displayed lower in the stack.
Double click to show the values with respect to EBP also in the stack within the first column.
For example, ebp-4 is displayed in the list, in the first column of the stack. It also appears as ebp-4 in the clarification.
The position where ESP is located to reserve variables will always move up because it must respect the space allocated for the variables. For instance, when making the 4 push for MessageBoxA it places them above the reserved space in the ESP.
Look at the stack below to see the four arguments, marked in green, that were added above the reserved space, which is marked in red.
When entering MessageBoxA, the return address of that function is stored on the stack.
Press F8 in MessageBoxA to find the return address of thr function.
Return just below the function call to MessageBoxA.
The “push”ed values saved for MessageBoxA and the return address of that function are ib use. The value of ESP is just above the reserved area as it was before calling any function. The call to printf will save the original function’s parameters with push and the return address. The ESP address will increase but when leaving the function it will lower again just above the reserved area.
Once you pass over the printf, the buf and cookie addresses are printed.
Addresses vary depending on the machine and set up. For instance, in the above example, the address of buf is 19fed4 and the address of cookie is 19ff24.
There we see that the application uses EBP-54. This is the address of our buf (19fed4 in this example). When you double click on the stack, the debugger will show the address as $-54.
See how bytes are saved elsewhere by placing the address where data is saved in the dump.
There it is, more up it’s not displayed because there is no more data below.
When you press F8 on the console, type the data you want to send and press enter. This will fill the buffer, as well as the cookie value.
In the above example, the cookie was at address 19ff24.
Next, we can compare the cookie with the address 0x41424344.
We see that EBP-4 says that it is a cookie, in addition to the address if we reset the HORIZON to the value of EBP as before.
Double click to see that EBP-4 is a cookie since it is in the -4 of the stack by zeroing the HORIZON.
The program will not jump and produces our desired output of ”you win!”
We have now both achieved the objective manually and dynamically analyzed stack1, using the X64dbg debugger. This debugger does not allow us to analyze an application without running it through the program. In order to conduct a static analysis, we must use other tools such as IDA PRO, GHIDRA or RADARE.
Next, make a script model to exploit the exercise from Python.
If using Python 3, place the parentheses in the print command and be careful when adding strings that must be bytes. Place a ‘b’ in front of strings that originated in Python 2).
I notice that the path is correct and when running it.
With a Python 3 script model ready to exploit stack1, you’re ready to move on to part three, where we will continue with static analysis of this exercise using IDA, RADARE and GHIDRA.
In addition to stack1 there is also stack2, stack3 and stack4, which can be solved as supplementary exercises.
In part three, we will see IDA FREE, RADARE, and GHIDRA.
*** This is a Security Bloggers Network syndicated blog from Blog RSS authored by arysavy. Read the original post at: https://www.coresecurity.com/article/reversing-and-exploiting-free-tools-part-2
