

Digression to Regression
After our risk quantification series, it should come as
no surprise that we like numbers and measuring. However, when confronted
with the question, “Why do you need to translate code into vectors?” I’m
not sure what to say.
Almost all machine learning algorithms in abstract, and the concrete
tools and libraries from the Python data science toolset (Numpy,Pandas, Keras) expect the features and targets to be real-valued.
They rely on concepts such as distance, error, and cost functions,
and they attempt to minimize the latter by adjusting their inner
parameters. All of these concepts are inherently mathematical.
Out of all of these algorithms, the easiest to understand well is
perhaps the simple linear regression. So, let’s start with that.
Regression is a fundamentally different kind of task from the ones we
have discussed the most in the
series, which are classification and
clustering tasks. Regression aims to predict a number taken from a
continuum instead of answering “yes” or “no” or to tell from which
group an input most likely belongs.


The situation is this: we have two variables that appear to be linearly
related, and we would like a model that generalizes that relationship.
Simple linear regression is used for many interesting purposes, such as
determining:
he relationship between the sales price of an asset vs. its age,
i.e., understanding depreciationthe fuel efficiency of a vehicle: fuel consumption vs. distance
coveredthe effectiveness of advertising: money spent on ads vs. revenue
indirectly measuring physical quantities, such as speed or
acceleration
In the first three examples above, it could be argued that there are
other variables at play, that the relationship might not be necessarily
linear, etc. But in the last case, and under lab-controlled conditions,
it is true that the position x of an object that moves at constant
speed v after a time t departing from an initial position i is
given by x = vt + i. Suppose we want to know the speed v using only
a ruler and a watch. If measurements were perfect, we would only need
two, for we have two unknowns: v and i. However, in reality,
measurements are not perfect, so we need to take several measurements,
and sort of “average them out” via fitting a line, i.e., the regression.
We can take several measurements of x and t, which we might register
in a table like this:
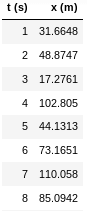
Figure 1. Position vs. time, first few observations
This doesn’t say as much as a plot:
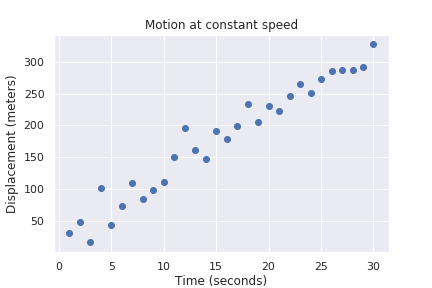
Figure 2. This shows positive correlation
Here we see there is a clear linear relationship, but no single line
would perfectly fit all points. The goal in linear regression is to find
the line that best fits the points. But what is the “best” fit? There
are several choices, and each of those choices would represent a
different model. The standard in linear regression is to minimize the
sum of the squares of the errors for each observation. What? Each choice
of v and i would produce, for each value of t, a corresponding
value for x, which may be close or far from the actual observation.
The difference between these two is called a residual. But we don’t care
about each individual residual, we want only to make them small overall.
So we add them all, but before that, we square them in order to avoid
the possibility that due to the signs, they might end up adding to
something close to 0. This is, in fact, the cost function for this
particular algorithm: different techniques come with different cost
functions and different ways to minimize them.
In simple linear regression, the expression for the cost function is
easy enough to solve with pen and paper. In other algorithms,
hill-climbing and gradient descent techniques are taken from
optimization. Even simple brute force (trial and error) might be used,
as long as the cost function is minimized.
Instead of implementing simple linear regression in pure Python, which
could be done, let this serve as an excuse to present the general
machine learning flow. The tool of choice to perform “traditional”
machine learning and data analysis in Python, i.e. everything but neural
networks, will be scikit-learn. The flow to
use this library is typically the same, regardless of how sophisticated
the chosen model:
- Create an illustration of the model:
Creating a linear regressor in scikit.
from sklearn.linear_model import LinearRegressionmodel = LinearRegression(fit_intercept=True)- Train (fit) with the data
model.fit(t, x)Assuming that t and x are NumPy arrays (a more mathematically
appropriate extension of lists) holding the time and position variables,
respectively.
- Make predictions
import numpy as nptime = np.linspace(0, 31, 1000).reshape(-1,1)xfit = model.predict(time)Create a new array holding a thousand evenly spread values for time, and
then use the trained model to predict their corresponding values in the
independent variable.
- Assess model performance
import matplotlib.pyplot as pltplt.scatter(t, x, alpha=0.7)plt.plot(time, xfit, 'red')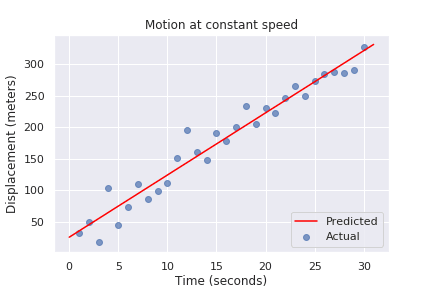
Figure 3. Regression line fits the data relatively well
In the case of simple linear regression, it is possible to see how
well the model performed (see above). Quantitatively, we can use the
R2 metric:
>>> model.score(t, x)0.9531426066695182The closer this value is to 1, the better the fit, and hence, the
regression.
That is, in a nutshell, how to make, train and draw predictions from
machine learning algorithms in scikit, with a few subtle changes from
one to the next, such as:
Usually, one splits the data into training, validation and testing
sets. However, the expected format remains the same. The features
or predictors (t above, but usually x) need to be an array of
vectors, and the targets or labels (usually y) a simple list
or1Darray.The validation and testing are performed in different ways according
to the task, since plotting them and getting a single evaluating
number as above is not always feasible.
Perhaps this helps to explain why you need to translate code into
vectors. More later, on why, and how to turn natural language and code
into vectors so that they might be used by standard ML techniques.
References
*** This is a Security Bloggers Network syndicated blog from Fluid Attacks RSS Feed authored by Rafael Ballestas. Read the original post at: https://fluidattacks.com/blog/digression-regression/
