

Architectural Limitations in Chrome Browser DevTools in Debugging Malicious Extensions

The past few years have witnessed a surge in malicious browser extensions, including the Geco Colorpick, Cyberhaven and the Great Suspender. These malicious extensions exfiltrate data, steal session cookies, spread spyware and even hijack browser sessions of victims. Critically, many involved benign extensions that turned malicious — either due to a compromise or change in ownership — exploiting trusted extensions with a wide existing installed base.
The majority of extensions today are downloaded and installed from official stores like Chrome Store, Add-ons for Firefox and Microsoft Edge Add-ons. These stores are owned and managed by browser vendors. As such, most individuals and enterprises heavily depend on browser vendors to conduct security audits on published extensions, relying store labels like “Verified” and “Chrome Featured Extension” as security indicators. Unfortunately, as previously discussed in our Browser Extension Whitepaper, these labels can be easily gamified by attackers with fake reviews and mass downloads. As a result, numerous Verified and Chrome Featured Extensions have been discovered as malicious, including the latest disclosure by Koi Research on Geco Colorpick and 17 other malicious extensions that were spying on at least 2.3M users combined.
In this month’s Year of Browser Bugs (YOBB) disclosure, we dive deeper into why it is impossible for browser vendors and enterprises to conduct thorough security audits on extensions. Specifically, the architectural limitations of browser devtools in debugging and identifying malicious extension behavior. This blog will cover the fundamentals of browser devtools, what they were invented for, its architectural limitations when it comes to debugging extensions and a novel approach to debugging extensions with SquareX’s Extension Monitoring Sandbox, which combines a proprietary modified browser and Browser AI Agents to simulate and monitor extension behaviors in real time.
Note: The architectural limitations disclosed in this blog are not limited to Chrome and apply to all other browser vendors. However, we have selected Chrome for illustration purposes as it is the most popular browser and has the most advanced devtools.
What are Browser Devtools?
Browser developer tools, commonly known as DevTools, are built-in diagnostic and debugging interfaces in modern web browsers that were originally created to help users and web developers inspect, debug, and optimize their websites and web applications. These native browser features evolved from early third-party tools like Firebug and are now standard components of all major browsers, providing deep integration with the browser’s internal systems without requiring additional installations. Today, these embedded tools have expanded far beyond their original development purpose, allowing users to examine HTML structure and CSS styling, debug JavaScript code, monitor network requests and performance metrics, analyze security vulnerabilities, inspect browser storage and cookies, and track resource usage. DevTools have become essential instruments not only for web development but also for security researchers investigating anomalous behaviors of sites to identify suspicious sites.
In order to ascertain whether a site is malicious, DevTools must allow users to conduct the following:
- Monitor all network requests made by the webpage
- Monitor code executed on the webpage’s context
- Monitor variables in the webpage’s JavaScript
- Inspect session tokens, user data and form inputs
- Track local and session storage contents
Inspecting Extensions with Browser DevTools
When it comes to inspecting extension behavior, Browser DevTools are met with several architectural limitations. This is not unexpected, as these tools were invented long before the widespread adoption of browser extensions. Thus, they were designed specifically to inspect webpages, a web component that is significantly less complex in nature.
Browser Extension Superpowers
To fully appreciate the limitations of Browser DevTools, it is important to first understand the “superpowers” unique to browser extensions. Among these are its ability to:
- Access HTTP-only cookies
- Bypass cross-origin request restrictions
- Observe tab updates
- Inject and run scripts on behalf of pages
- Read and/or modify any web page
- Read web page local and session storages
- Hijack functions and/or web APIs on a web page
- Inspect web requests
- Force notification and popup permissions for websites
- Take screenshots and record active tabs
In comparison, web pages operate a relatively simpler structure with limited ability to monitor or modify other web pages and/or tabs running in the same browser.
Architectural Limitations of Browser DevTools for Extension Debugging
Thus, Browser DevTools are unable to provide the level of telemetry and attribution required to debug browser extensions. Indeed, it is relatively trivial for malicious extensions to prevent suspicious data from showing in the DevTool console. For example, an extension can make a network request through any web page by injecting a script to the page. This would “fool” the DevTool into reporting this network request as being made via the web page. There is no way for the user to differentiate between network requests made natively by the web page or due to the malicious extension. In other words, given that extension can work across sites, there is no way to attribute a suspicious network request to an extension.
Some architectural limitations include:
- Difficulty in debugging content and service workers at the same time
- Lack of visibility in message passing and internal communications
- Lack of source attributions for injected Javascript (i.e. Javascript from the web page vs. Javascript injected into the webpage by an extension)
- Limited network traffic logging
- Limited insights into offscreen document to inspect background processes, hidden extension pages and action/time trigger behaviors (i.e. pop-ups/extension behaviors triggered by time and/or user action)
The SquareX Extension Analysis Framework
As extensions become a core part of our workflow, it is critical for enterprises and individuals alike to understand the security risks associated with each extension they are using. Given the complexities of browser extensions, this is only possible with a tool designed specifically to inspect an extension’s true behavior.
SquareX’s Extension Analysis Framework is designed to do exactly this. The framework is made of three components:
Metadata Analysis
All publicly available extension data including developer reputation, permissions and social metrics
Advanced Static Code Analysis
SquareX’s proprietary advanced static code analyzer is trained specifically to analyze extension code, including all files, functions, API calls and variables to identify security vulnerabilities and secret leakage
Dynamic Analysis
SquareX’s Extension Monitoring Sandbox simulates different user personas with AI agents and monitors each extension’s behavior at runtime, including network requests, API calls and DOM interactions for malicious behavior
More details on the SquareX’s Extension Analysis Framework can be found on our Browser Extension Whitepaper. However, this paper will focus on the third component — dynamic analysis — and the browser modifications required to build the Extension Monitoring Sandbox.
In addition, SquareX is also conducting a free enterprise-wide extension audit in the month of August. The audit involves conducting an extensive audit of all extensions installed across the organization using all three components of the SquareX Extension Analysis Framework, providing an analysis of an organization’s extension risk posture and a risk score for each extension. To sign up for the free extension audit, sign up on SquareX’s website by 31st August 2025.
Building an Extension Monitoring Sandbox
Given that existing browsers do not have the capability to monitor extension activities at runtime, a modified browser with such capabilities is required. The purpose of the Extension Monitoring Sandbox is to simulate multiple user workflows in the context of the extension (i.e. different ways in which a user may interact with a given extension) in an environment where all extension behaviors can be monitored for further security risk analysis.
There are two key components to the Extension Monitoring Sandbox:
The Modified Browser
SquareX’s proprietary modified browser is loaded with SquareX extension, which monitors all extension behavior at runtime, including network requests, API calls and DOM interactions. Using a modified browser allows SquareX to collect rich data on an extensions behavior that would otherwise not be possible on popular browsers such as Chrome and Firefox due to permission restrictions. There are three components to the Extension Monitoring Sandbox:
- Browser Setup: A hardened fork of Chromium is used, instrumented with hooks into the Chrome Extension API surface. All Chrome API calls (chrome.*) are logged
- Custom MITM Proxy: proxy that intercepts all network requests (GET, POST) along with the timestamps
- Process Isolation: Each extension is installed and runs in a separate setup
Trigger Simulation with Browser AI Agent Personas
Once an extension is installed in an Extension Monitoring Sandbox instance, SquareX will create multiple personas to simulate a real user’s behavior and monitor the extension behavior at run time. This exercise is completed for multiple scenarios as extensions often employ conditional logic that activates functionality only under certain user behaviors. This trigger simulation is completely automated with AI agents, including:
- Persona Generation: Use LLMs to generate user personas based on extension category and metadata. E.g., crypto-focused persona for crypto wallet extensions.
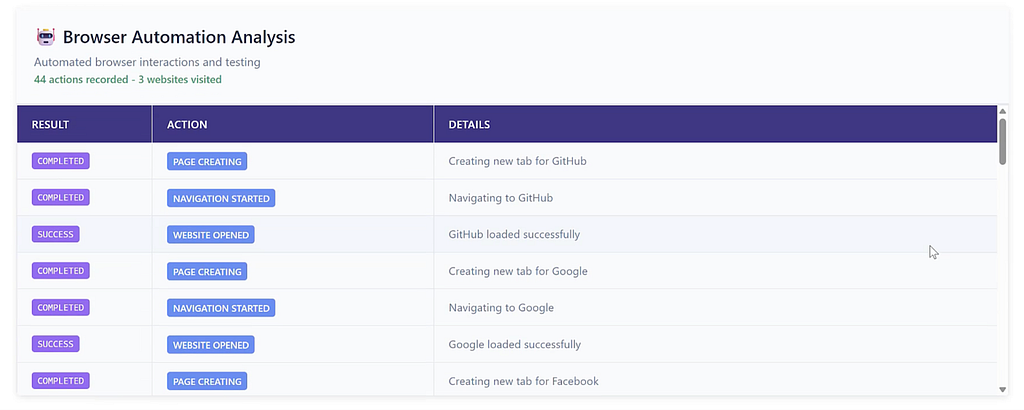
- Automated Browsing: LLM generated Puppeteer-script simulates persona-driven interaction, including page visits, scrolling, clicks, copying to clipboard and typing.
- Active Stimuli: We use Agentic AI to interact with the extension’s UI elements to surface conditional logic and buried functionalities.
Each extension is tested for multiple personas with different browsing habits, geographies, languages, and user intents in order for a comprehensive exploration of extension behaviors that may only be triggered by certain pathways.
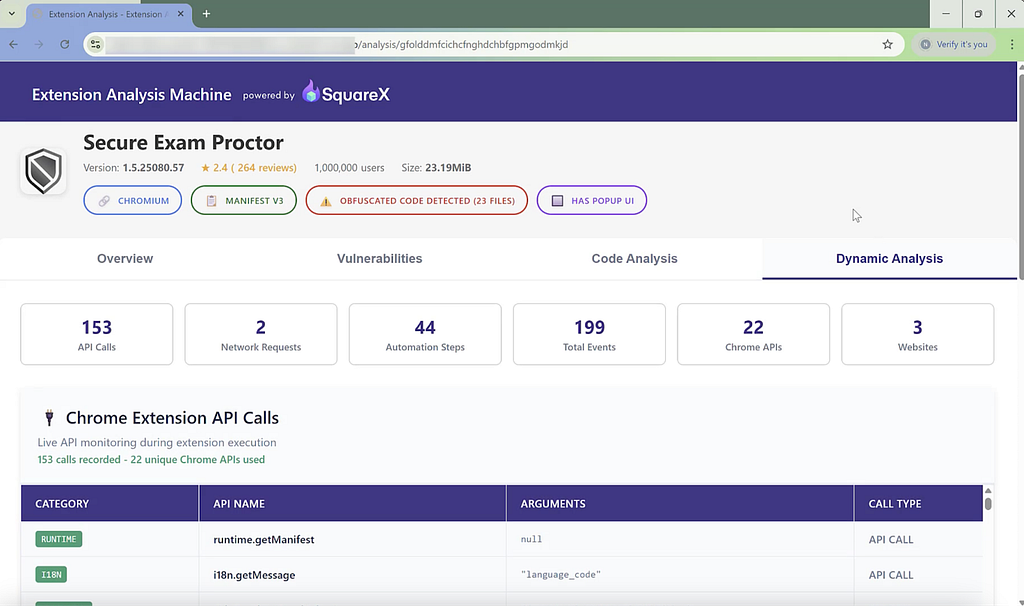
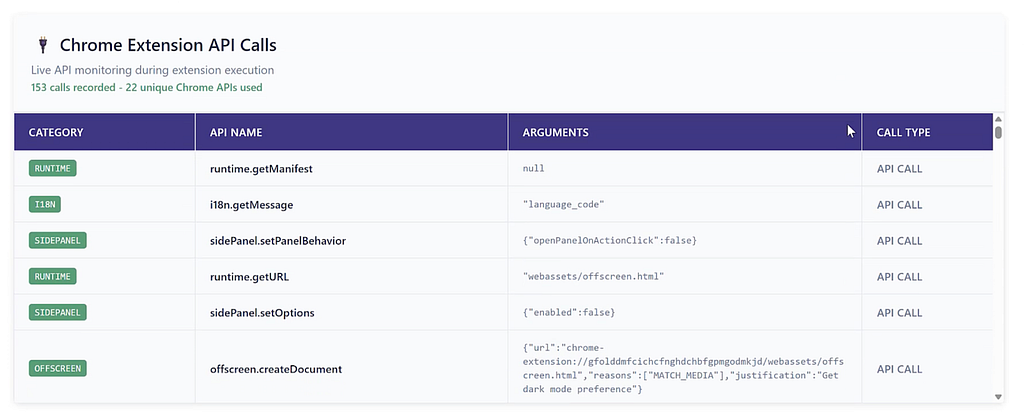
During these simulations, the Extension Monitoring Sandbox logs all extension activities, including API calls, network requests, automation steps, websites and events involved. This allows detailed behavior logging and classification, including:
- API Invocation Timeline: Temporal ordering of Chrome API calls.
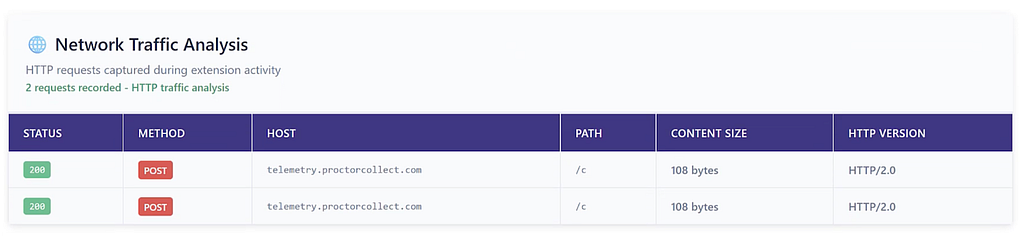
- Network Activity Timeline: Recording of network endpoints accessed and traffic patterns.
- User Data Leakage: Observations of clipboard access, DOM scraping, credential harvesting attempts.
This information is then used to perform a detailed dynamic analysis of the extension’s runtime behavior to provide a risk assessment and details on any associated security risks.
Modifying a Browser for an Extension Monitoring Sandbox
In order to build an Extension Monitoring Sandbox, the following modifications are needed for the Chromium Browser.
Expose and Monitor Subsystem Interfaces
This includes monitoring all extension API calls and network requests. SquareX monitors API calls initiated by both the (i) extension’s service worker and (ii) individual content scripts from each tab. When it comes to network requests, SquareX keeps a tab on all network requests initiated by the service worker and content scripts. This allows granular source attribution of how each API call and network request is made down to the line number of the relevant Javascript function.
Instrumentation of the API Arguments and Call Stack
This involves logging and analyzing the specific data or parameters that get passed to API functions when they’re called in real-time. This allows for a clear API invocation timeline to understand exactly when, how and why each API call was made. This telemetry is then used to deduce suspicious patterns like unauthorized data access that may indicate API misuse.
Add Software Debugging Statements
Software debugging statements are added in different points of the Chromium source code. This allows logging to happen at specific “tap points” in the browser itself, which can be modified in the configuration file. This allows SquareX granular control when debugging extensions, revealing interactions that might not be inspectable via existing Browser DevTools.
Visibility into Background Processes
This involves exposing background processes run by the service worker or WASM modules that may not be directly visible to the user.
Extending Chrome DevTools Protocol
Enhance existing debugging protocol to provide deeper hooks into extension-specific operations that are not covered by standard Browser DevTools.
Support for Remote Log Ingestor
Enables centralized collection of extension activity monitoring logs for security analysis and risk score assignment.
Free Enterprise-Wide Extension Audit
This August, SquareX is conducting a free enterprise-wide extension audit. The audit involves conducting an extensive audit of all extensions installed across the organization using all three components of the SquareX Extension Analysis Framework, providing an analysis of an organization’s extension risk posture and a risk score for each extension. To sign up for the free extension audit, sign up on SquareX’s website by 31st August 2025.
Architectural Limitations in Chrome Browser DevTools in Debugging Malicious Extensions was originally published in SquareX Labs on Medium, where people are continuing the conversation by highlighting and responding to this story.
*** This is a Security Bloggers Network syndicated blog from SquareX Labs - Medium authored by SquareX. Read the original post at: https://labs.sqrx.com/architectural-limitations-devtools-extensions-890e07e07e7f?source=rss----f5a55541436d---4
