

By the Numbers: The State of Security in eCommerce
The ongoing global pandemic has accelerated eCommerce growth and pushed more consumers online. More consumers mean a larger threat landscape and ensure that cybersecurity issues remain a significant, ongoing challenge for the retail industry.
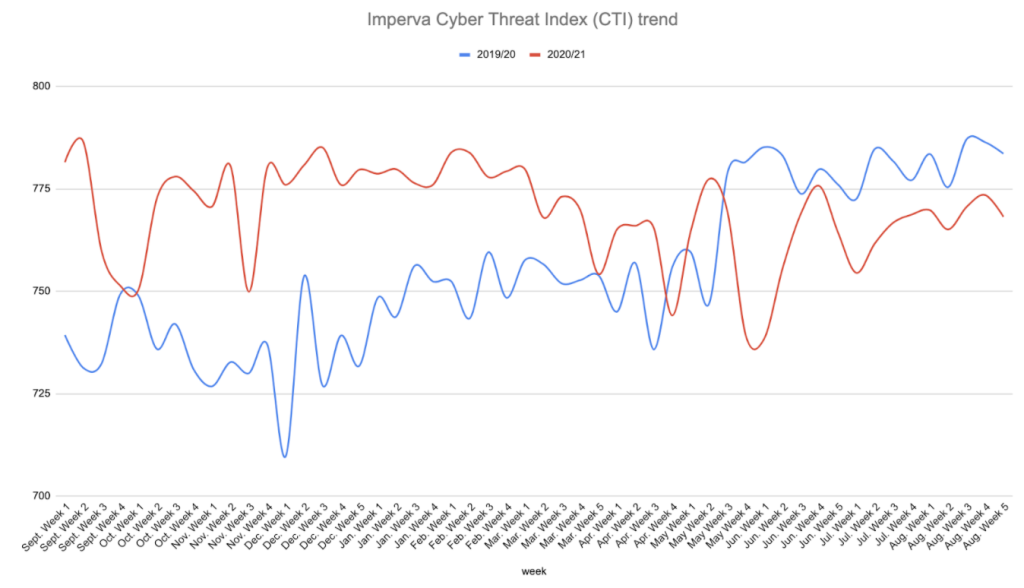
Based on a 12-month analysis by Imperva Research Labs, threat levels remain elevated compared to previous years. As we can see in the chart below, threat levels from August 2020 to March 2021 (red line) have been significantly higher than those of the previous year (blue line). While attacks during the second half of 2020 were greater than the current 2021 levels, there is still reason for caution and for organizations to be on alert.
More numbers that explain the state of security in eCommerce:
$4.921 trillion – Total revenue from eCommerce sales predicted in 2021 – a 16.8% year-over-year increase. Source: emarketer.com
11.11 and 11.23 – Singles Day (11 November) and Black Friday (4th Friday in November) in the West when high-traffic online shopping drives a peak in cyber attacks (see this in the chart above).
57% – Segment of attacks on online retail websites that were carried out by bots in 2021, vs. 33% for all industries.
788% – The global increase in bad bot traffic to retail websites between September and October 2020, just as pre-orders for next-generation gaming consoles were launched.
31.3% – The segment of all web application attacks on online retail websites that resulted in data leakage.
73.3% – The portion of requests in attacks on retail websites that were made from a public cloud service.
45.9% – The portion of API attacks targeting the retail industry that were launched from Spain, the most from any country.
25% – The amount of online retail traffic that is bad bots, with 42.2% of that traffic classified as moderate bad bots.
32.8% – The portion of all bad bot attacks on retail websites that are account takeover (ATO) attempts, trying to steal saved credit card information, gift card balances, loyalty points, and more.
47.3% – The portion of all bad bot attacks targeting the USA, the top country target worldwide,
with 61.6% of all DDoS attacks targeting USA-based retail websites.
83% – The portion of retail websites running third-party JavaScript-based services executing on the client-side, the most of any other industry. This presents the greatest risk of a compromise in original tag JavaScript.
See all these numbers and more in this easy-to-share infographic.
Download the full report, The State of Security within eCommerce in 2021.
The post By the Numbers: The State of Security in eCommerce appeared first on Blog.
*** This is a Security Bloggers Network syndicated blog from Blog authored by Erez Hasson. Read the original post at: https://www.imperva.com/blog/by-the-numbers-the-state-of-security-in-ecommerce/
