

Beating the OWASP Benchmark
This post is an update to a previous research post authored by ShiftLeft’s Chief Scientist, Fabian Yamaguchi (https://blog.shiftleft.io/beating-the-owasp-benchmark-24a7b1601031). In the last article, he evaluated ShiftLeft’s static analysis tool against the OWASP Benchmark. ShiftLeft’s tool achieved a true-positive rate of 100% and a false-positive rate of 25%, making it the best-in-class SAST tool in terms of benchmark score. He also explains how we achieved the score using our unique information flow approach.
But it is often hard to replicate scores claimed by vendors. So today, we present a way to benchmark ShiftLeft’s tool by yourself. Our team has built in the OWASP Benchmark as a demo app on our platform that you can run in just a few clicks.
This post is co-authored by Fabian Yamaguchi, Katie Horne, Chetan Conikee, Hubert Plociniczak, Malte Kraus, and Olof-Joachim Frahm.
Measuring the success of a security tool
Developers today are constantly pushing out code as we as an industry move towards continuous delivery. As the amount of code written and deployed increases, so does the demand for automation in security. Most of the time, we use static analysis testing to automate finding vulnerabilities in code.
There are the basic factors you’ll need to consider when evaluating a static application security testing (SAST) tool, such as language compatibility, ease of use, and cost. However, once these criteria are met, how do you determine which one is the most accurate?
The OWASP Benchmark Project is a Java test suite designed to evaluate the accuracy of vulnerability detection tools. It is a sample application seeded with thousands of actual instances and false positives of vulnerabilities from 11 categories. You can see how accurate a tool is by its position on the OWASP Benchmark scorecard.
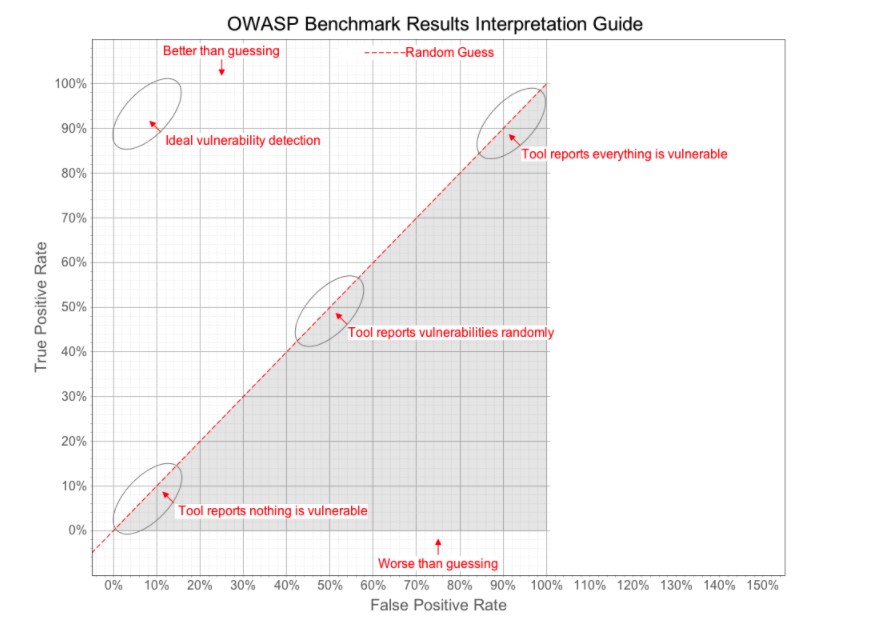
The OWASP benchmark “score” is calculated using Youden’s index. Youden’s index is a single statistic that captures the tool’s performance by subtracting its false-positive rate from its true-positive rate. The index has a value between 0 and 1. And a Youden’s index of a perfect tool would be equal to 1: 100% true-positive rate and 0% false-positive rate.
Before we go on, it’s important to keep in mind that the OWASP benchmark is not a perfect measure, but a window into a tool’s ability to find vulnerabilities. First, I believe that the separate true-positive rates and false-positive rates of a SAST tool are more important than its Youden’s index. From a security point of view, the consequences of not finding a true-positive are often higher than dealing with a false-positive, depending on the nature of the vulnerability in question. There is also the issue of trade-off between analysis speed and false-positive rate. Practically, a tool that produces no false positives but takes a lot of time to scan can be just as much of a bottleneck in the development workflow.
We will be using version 1.2 of the benchmark. Version 1.2 is designed to accommodate a wider range of testing tools, so test cases were significantly slimmed down from 21k to 3k cases from version 1.1. The benchmark also represents synthesized examples of vulnerabilities that are quite simplistic. So I would encourage you to play with the code snippets in the benchmark and see if vulnerabilities disappear when additional sanitization techniques or complexities are added to the vulnerable flows.
In short, nothing beats running a tool against a real-life application, so feel free to submit your own code to ShiftLeft’s platform and see what you find.
Testing our tool
Want to benchmark ShiftLeft CORE by yourself and see it in action? Take the OWASP challenge here.
We will be using the OWASP Benchmark test suite v1.2 to assess ShiftLeft’s code analysis engine’s accuracy. We have created a demo that allows you to scan the OWASP Benchmark Project application using ShiftLeft CORE.
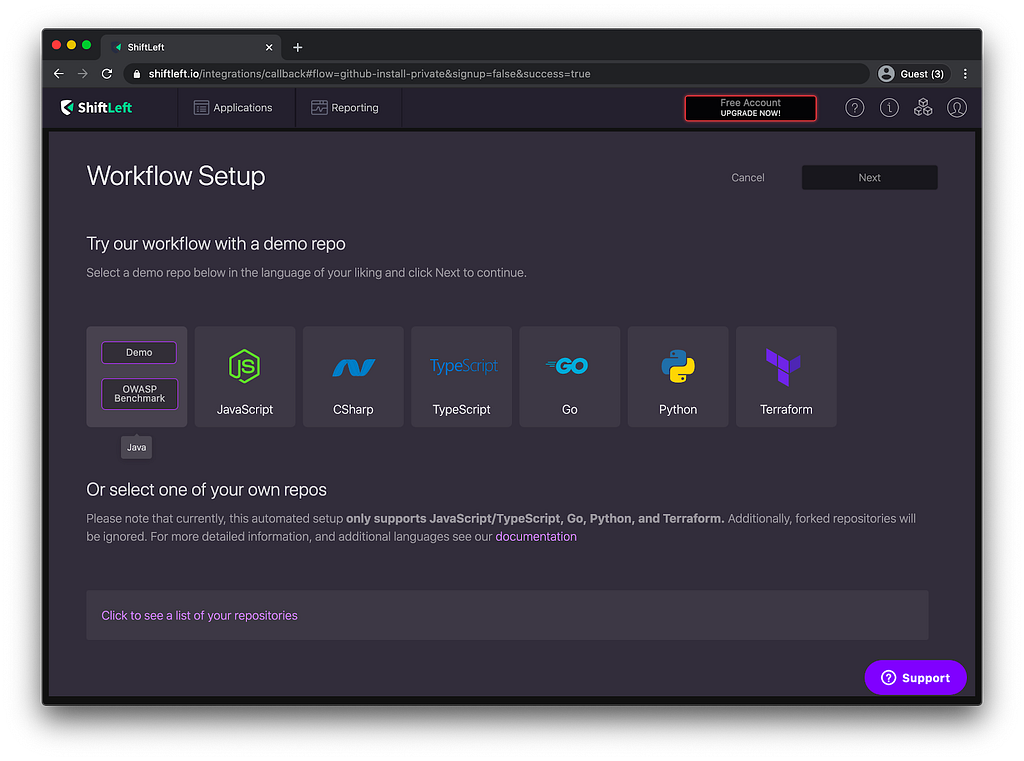
Register for a free ShiftLeft CORE account here. After you register, you should be automatically redirected to the repository selection page. Select “Public and Private repos”. Then go to “Java > OWASP Benchmark”, and click on “Next”.
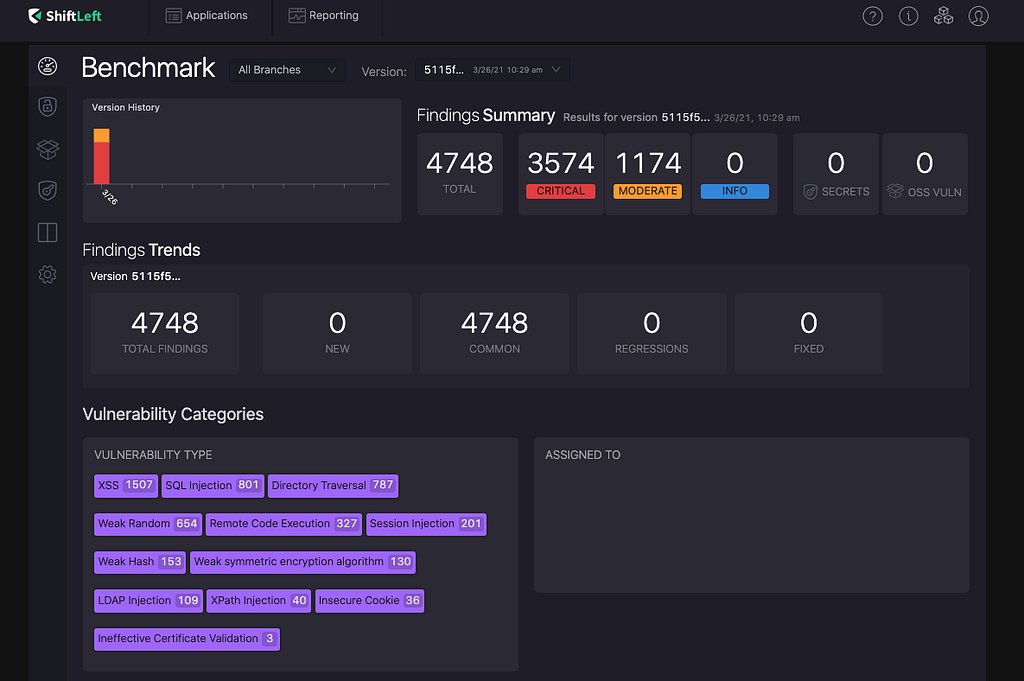
Click on “Benchmark” on your dashboard and you will see the vulnerabilities ShiftLeft found in the benchmark.
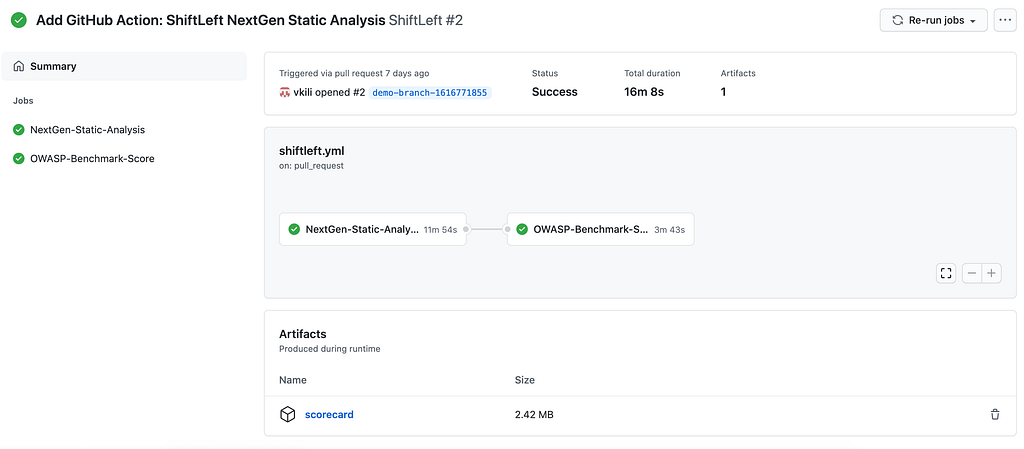
Now when you access your Github account associated with your ShiftLeft account, you will see a repository named “Benchmark”. Here, you can download ShiftLeft’s OWASP scorecard. This functionality is implemented via scripts that extract ShiftLeft results and convert them to OWASP-specific categories. This prepared data is then submitted to the official OWASP scoring mechanism. To download the scorecard, go to Actions in the Benchmark repository.
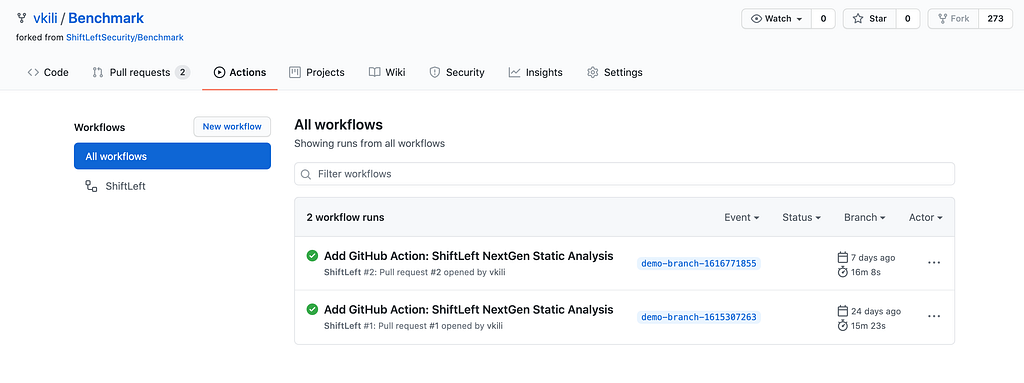
Find the most recent workflow run and click to open. Scroll to the bottom to find the Artifacts produced during runtime. Click scorecard to download the zip file.
The downloaded archive should unzip into a folder named “scorecard”.
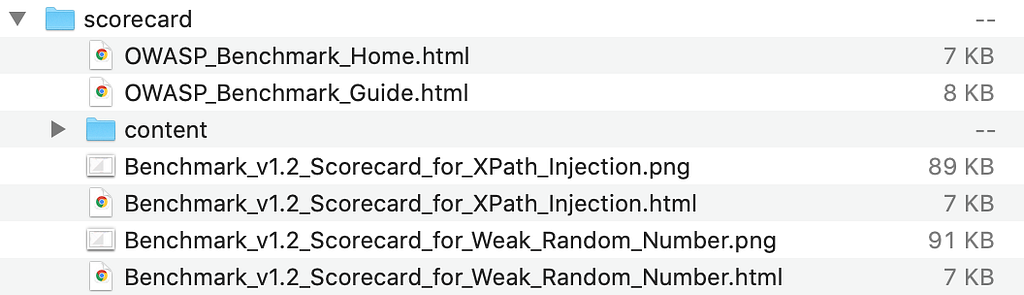
Open “OWASP_Benchmark_Home.html” to access the results.
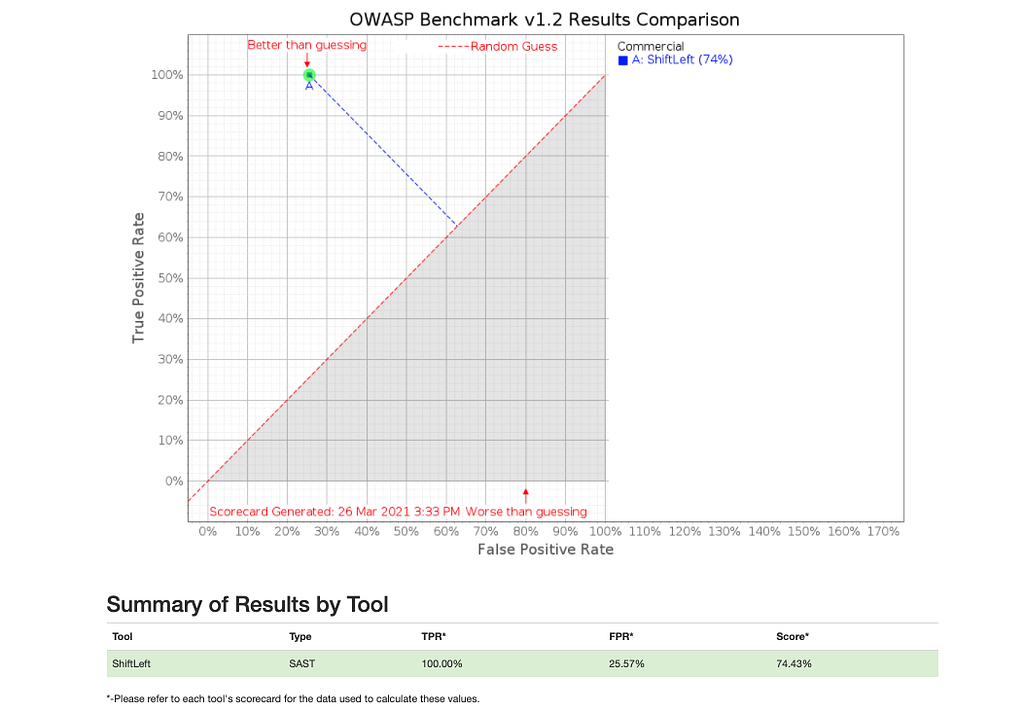
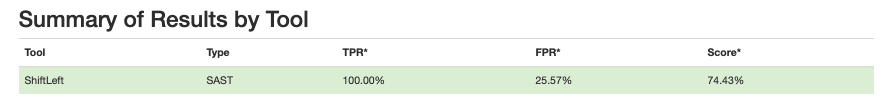
You’ll see from the scorecard that ShiftLeft achieves a score of 74% with a true positive rate of 100% with a false positive rate of 26%. The resulting Youden’s index of 74% is way ahead of the industry average of 26%.
Comparing results
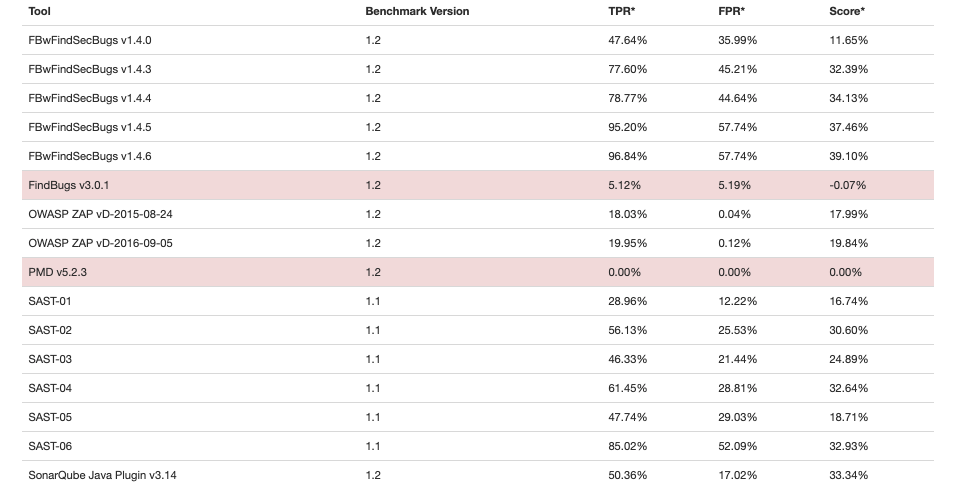
In comparison, on the OWASP Benchmark’s project site (accessed on 3/31/2021), you can find the scores achieved by some open-source and commercial tools.
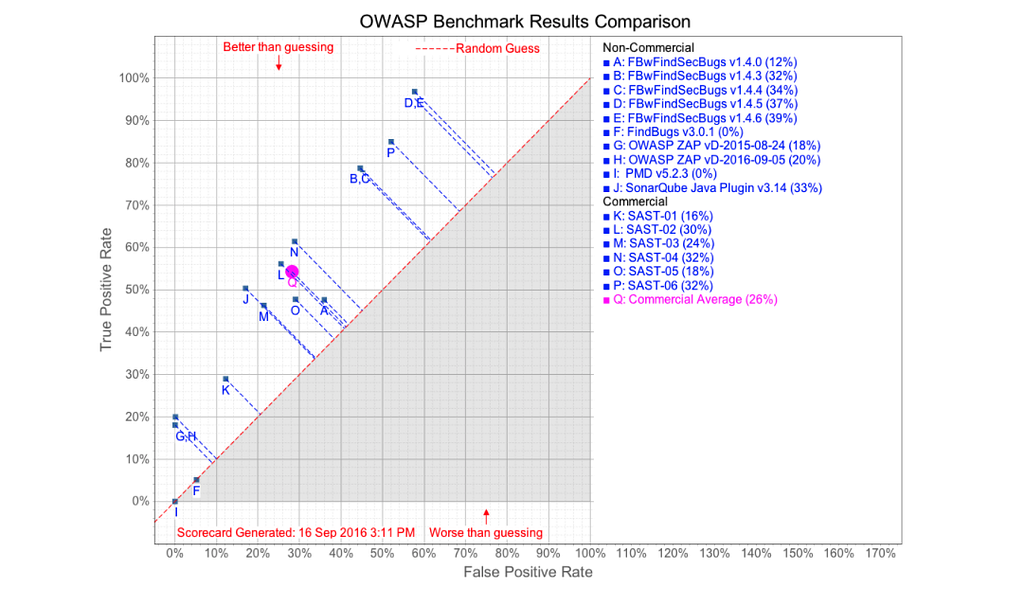
And in direct comparison to other tools in this survey, ShiftLeft is the only tool that achieved a 100% true positive rate.
Here’s a video tutorial of how to replicate this experiment on your own machine.
You might ask: how is this possible?
The precision of our analysis comes from our ability to track data and information flows. We built our state-of-the-art data-flow tracker by combining many techniques developed in academia for automated vulnerability discovery.
When you track data flow for security analysis, it is not sufficient to track single data flows between APIs. Instead, we need to focus on tracking the flows of sensitive sources and sinks within their contexts. Let me illustrate this with an example. This snippet is a negative test case for reflected-XSS taken from the benchmark.
Let’s analyze this piece of code on a high level. An HTTP request is passed to a post handler called doPost (line 1). The code then extracts parameters from the request via the method getParameterMap (line 5). The code retrieves the parameter vector (line 9). The parameter is then stored in the variable param (line 11), passed through the escape function htmlEscape (line 15), and renamed to bar. bar is used in the initialization of an array (line 16), and finally, this array is passed to the method printf (line 17). From this data flow, we’ll see that the unsafe data is passed through an escape function HTMLEscape. This functionality is therefore not vulnerable to reflected XSS. Using this information, we can formulate a rule that detects reflected XSS:
CONCLUSION reflected-xss = FLOW IO (http)
-> DATA (NOT encrypted AND NOT hashed AND NOT escaped AND NOT encoded)
-> IO (print)
This rule specifies that a data flow from an HTTP input to a print operation is a reflected cross-site-scripting vulnerability if the data is not encrypted, hashed, escaped, or encoded on the way.
But the analysis from this data flow is far from perfect. For starters, it does not tell us where data is written, that is, back into an HTTP response, and that this response is written as “text/html”. This is problematic because, without this information, we cannot distinguish between true candidates of XSS (like our example) and other suspicious flows. What if, instead of writing unsafe user data back to the HTTP response, the code is outputting elsewhere? Would that functionality still be a candidate for reflected XSS?
Our data flow tracker sees the code in a very different way. It sees multiple data flows: the high-level data flow we just mentioned and all flows that initialize sources, sinks, and transformations. This provides us with accurate information on where data comes from, where it goes, or how it is transformed during its lifetime.
We see that the PrintWriter (line 17) is initialized from the HttpServletResponse (line 2), and hence, the data will be written into an HTTP response. We also see that the data will be returned as “text/html”, since the method setContentType is called on it as part of its initialization (line 4).
Because our tracker has much more insight into the context of the data flow, we can formulate rules for their classification much more precisely and avoid many false positives and false negatives along the way. For example, we use the following rule to describe reflected cross-site scripting vulnerabilities.
CONCLUSION reflected-xss = FLOW IO (http)
-> DATA (NOT encrypted AND NOT hashed AND NOT escaped AND NOT encoded)
-> IO (print AND http-html)
This rule specifies that a data flow from HTTP to a print operation known to write HTML to HTTP is a reflected cross-site-scripting vulnerability if the data is not encrypted, hashed, escaped, or encoded on the way.
Static analysis is the most efficient way of uncovering vulnerabilities in your applications. If you’re interested in learning more about ShiftLeft CORE, visit us here: https://www.shiftleft.io/nextgen-static-analysis/.
Thanks for reading! What is the most challenging part of developing secure software for you? I’d love to know. Feel free to connect on Twitter @vickieli7.
Beating the OWASP Benchmark was originally published in ShiftLeft Blog on Medium, where people are continuing the conversation by highlighting and responding to this story.
*** This is a Security Bloggers Network syndicated blog from ShiftLeft Blog - Medium authored by Vickie Li. Read the original post at: https://blog.shiftleft.io/beating-the-owasp-benchmark-c1e1ced4bf1a?source=rss----86a4f941c7da---4
