

Visualizing program structure characteristics for 12 million lines of code
Static code analyzers can detect security vulnerabilities. They also provide an unusual perspective on the structure of the code they analyze. This perspective offers a glimpse inside the internals of programs that is different than either textual representations, binary representations or formal specifications. A sweet spot in abstraction depth that focuses on structural elements which are security relevant and drops everything else.
ShiftLeft provides a free code analysis tool. Click here to start with a free account.
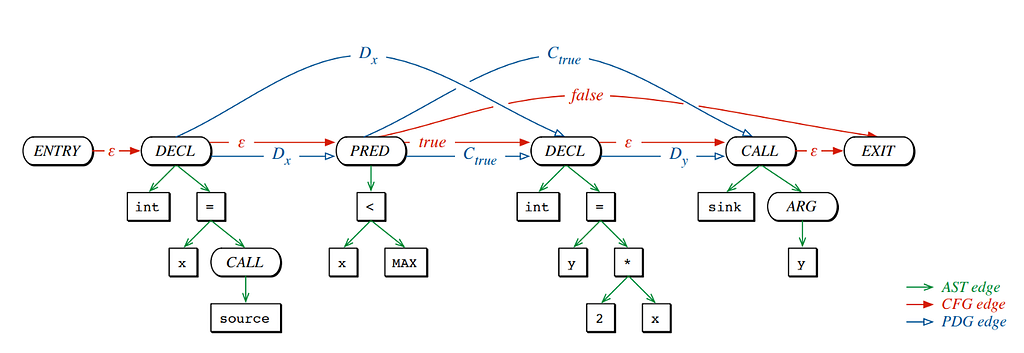
Code Property Graph
The Code Property Graph is a prime example of a data structure that works at that abstraction depth, and it is highly effective at detecting exploitable flaws in programs. But this data structure also provides a different view on programs, a view which will be demonstrated briefly in this post.
Analysis corpus and process
Twenty-four popular open-source projects have been chosen semi-randomly, all written in C, totaling at ~12 million lines of code. The goal is to uncover and visualize patterns in these programs using their Code Property Graph representation. For that, a data processing pipeline is set up with the simplest possible tools and a number of processing steps. After cloning the git repositories for the projects, the first step is to find the SHAs which represent the state of those projects at each business quarter going from 2020Q3 back to 2015Q3; 20 project states in total.
The second step is checking out those repositories at each defined SHA using pygit2. The third step is generating Code Property Graphs for each of those repositories using the Joern static code analyzer. Afterwards, the resulting Code Property Graphs are queried for various characteristics using CPGQL scripts executed by Joern. Finally, Python scripts are used to group the results of the script executions into CSVs which are loaded up in pandas DataFrames, filtered so that the data set is reasonably small, and plotted using plotly.
Methods increment/decrease over time
For our first analysis, we will start with something simple: how does the number of methods change over time for these open-source projects? The following interactive informational graphic points to a simple heuristic: the number of methods in popular open-source projects will grow slowly over time. Two outliers stand out: FFMpeg which seems to have had three refactorings done over the course of its development, and pyTorch which increased the number of its methods exponentially.
Patterns in program characteristics
The second analysis takes the characteristics of each method in the chosen open-source projects, and uses Principal Component Analysis to visualize emerging patterns. The number of lines of code, the number of control structures, the number of return statements, and the number of parameters are placed side-by-side, which helps uncover outliers. For example, sqlite has a method sqlite3VdbeExec with 7560 LOC and 1078 control structures, glibc has one named collate_read with 1435 LOC and 370 control structures and nmap has compile_branch with 2905 LOC and 588 control structures.
Operator usage across projects
The third analysis is simpler. It focuses on operator usage. Operators in the Code Property Graph can be addition, multiplication or modulo, but also shiftLeft, xor, postIncrement or cast. In the following visualization, operators for all chosen projects have been added together to show their frequency of use. A clear winner stands out: assignment. It’s followed closely by indirectFieldAccess and fieldAccess, unsurprisingly since we’re analyzing C codebases.
This concludes this brief foray into the world of programs viewed through the lens of Code Property Graphs. This data structure is capable of much more than simple analyses of structural characteristics, and I hope this post convinces that it is time well invested to learn about it and use it extensively.
Visualizing program structure characteristics for 12 million lines of code was originally published in ShiftLeft Blog on Medium, where people are continuing the conversation by highlighting and responding to this story.
*** This is a Security Bloggers Network syndicated blog from ShiftLeft Blog - Medium authored by Claudiu-Vlad Ursache. Read the original post at: https://blog.shiftleft.io/visualizing-program-structure-characteristics-for-12-million-lines-of-code-6c50ec69db8d?source=rss----86a4f941c7da---4
