

Vulnerability Management Maturity Model Part II
Hello again everyone. I hope you enjoyed the summer and the time you spent actively studying the SANS Vulnerability Management maturity model that was released in May (and can be found here ). Over the summer I expect you ordered your own copy (or 10) and wallpapered your office with it after you read Part 1, where I discussed the model, how things were laid out, and some of the background information. Good stuff, but it may not have left you feeling all warm and fuzzy inside. Why? I left you hanging (yes, dear reader, it was on purpose).
You were left with that empty feeling inside, and you had nagging questions on the VMMM (that’s Vulnerability Management Maturity Model for those of you that forgot), and wanted to see, through examples, how this could be applied to YOUR organization, and help YOU deal with the issues you have. Because let’s face it, we don’t care about the theory behind it all, we want to solve our problems so we are not dealing with those panicked phone calls/emails/pages (I am showing my age with that last one).
Fear not, my trusting Padawan, I will show you how to cut through the VMMM and extract those nuggets of information you are looking for. (Every time I say VMMM out loud, I start to think of a good snack for some reason). A tour guide if you wish. A mentor. And we will do it with a couple of examples. And with these examples, we will flip the tables a little bit, and not look at each of the lines and how you move through those. We will take where a program is currently at, and see how the VMMM can guide us and give us some ideas on what we can do to move our programs forward.
As the reference point, here is the VMMM again (damn, I’m getting hungry here) and you can click on it to go directly to the downloadable poster. Remember that we were, for some reason, put on page two (I’m working to change that for the next release).
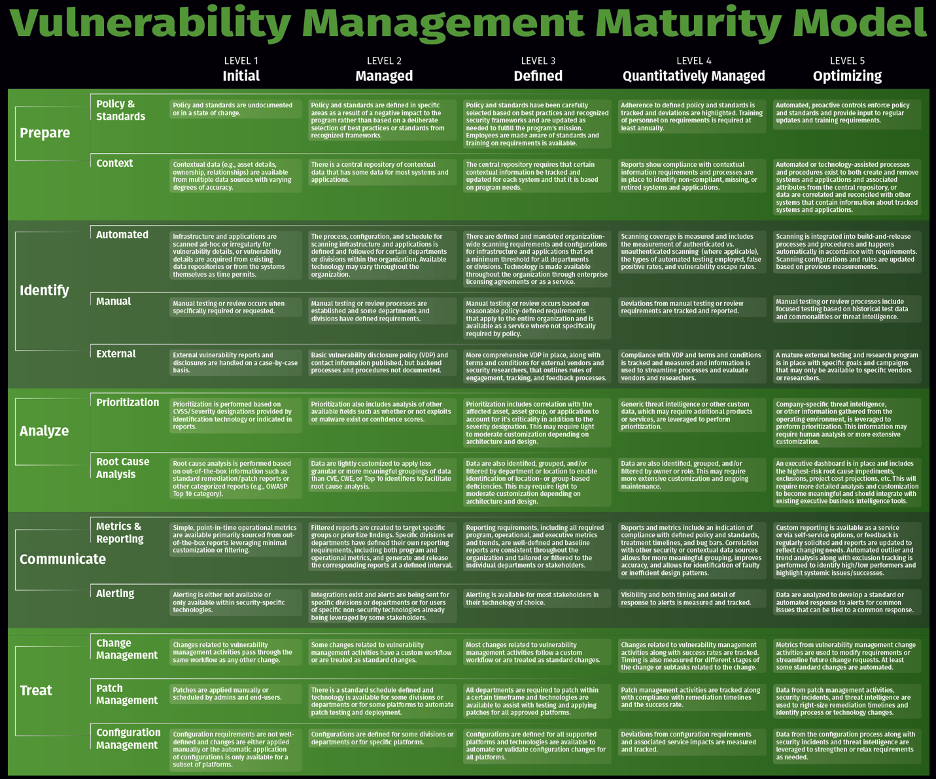
Let’s take a look at our first example: Prioritization. Everyone loves prioritization. Why? Because it helps us figure out which of the 10 gazillion problems to deal with first.
So, in our imaginary company, we have a deployed vulnerability scanner. And it has been running without an issue, scanning devices as needed, polling the agents and we have this big long list of issues. We’ve been looking at the results within the scanner, and we have been trying to figure out which problems to deal with first.
And, as you can imagine, the obvious choice has been to leverage the CVSS scores. A finding that has a value of 10 means we yell screaming through the office that the sky is falling and the world is ending if we don’t fix this right away. (if you do this, please video it and send me a link. I’ll share it in my next MGT516 class). But we have run into a conundrum. We have way too many vulnerabilities that have the same score. We are down from 10 gazillion to only 1 gazillion, but alas, that’s still a gazillion problems to get done before we go home.
We feel that each day is the same as the last. We are living the Groundhog Day movie, and this is the 287 time through it.
What can we do? “I want to make my program more robust” you say to yourself. It has to get better than where it is today.
Looking at the maturity model, in level 2, we see that we see mention of leveraging more context and information, specifically if exploits are available for vulnerabilities. You dig deep into the recesses of your mind and recall from the vendor presentation about your vulnerability scanner that they did have a license you could buy that would let you see that information within the scanner.
Reaching for the phone with one hand, and the corporate credit card with the other, you quickly get the license key and have your team install it into the scanner. After the license is applied, your team advises that they are seeing an improvement, and there are only 1 bajillion items in the scanner that are of high importance and that exploits are available for.
You leave instructions for them to start working on it, and head home.
Your work here is done. More details for the vulnerabilities and the program will be better off from it.
When you go into work tomorrow, you think to yourself, what could you do to further the prioritization work that the team is doing at the moment. While the exploit information did help reduce the number of vulnerabilities that they needed to look at, you are still concerned that there may be too many. What else could be done to advance the program?
Again, looking at the maturity model, you see that there is mention of asset groupings and asset criticality to the organization. You hear a “DING” sound as an idea forms in your head. You make a note to see what that sound was from.
Gathering your team together, you brief them on the idea. You want them to come up with company-specific asset groupings that can be placed into the vulnerability scanner. You ask them to define these groups based on the asset criticality and asset location within the network.
Now, this is going to take some time, both to define the various groups, and configure the scanner with all this new information.
After a few months, and all the work the team has done, you ask for a report of the critical assets and the vulnerabilities associated with them. The report shows the critical asset groups (it was decided to have 7 groups in this category, as your organization is across multiple cities). Within each of these groups, it now shows the high scoring vulnerabilities that have exploits available listed first.
And it is an almost manageable list. Only thousands within each of these groups. Not those gazillions we started out with. We have moved in the right direction for sure. The team isn’t as lost anymore on what to tackle. There is still a lot of work, for sure, and it isn’t perfect. But it is chunked into more manageable pieces.
Now, I’m going to make you do a little bit of work, dear reader. If you wanted to continue to advance the program, what could we add to the prioritization equations?
Take a look at the VMMM. I’ll wait.
Really, I will.
What do you think?
That’s right, Threat Intelligence. (It IS in the VMMM if you looked back at that) If we were able to leverage threat intelligence, we could further refine the prioritization methods being used. (And for those of you that said a chocolate bar instead of threat intelligence, I’m with you. ) This can be done either through further licensing in some vulnerability scanners, adding in a new service that gives you the TI feed or through additional products that leverage TI feeds.
Regardless of which route you go, you need to ensure a couple of things with threat intelligence:
- You have a way to ingest the information
- You have a way to fuse the data with your vulnerability information
Threat intelligence (as we want to use it for vulnerability management) is of no use without either of those items. It also needs to be relevant to your organization (There will be minimal help to your banking organization if you have a healthcare TI feed. Why pay for something that will not give the most useful information for your organization?)
Bonus points to those of you who wanted to go straight to level 5 and use company-specific threat intelligence. Doing this will help for sure, but there is often a lot more customization needed to leverage internal information. We need to link our incident response information, our sensors (e.g. IDS, IPS, firewalls), our aggregation tools (e.g. SIEM) together with our vulnerability information. This is normally done through a data warehouse and requires customization. It isn’t for the beginner for sure and requires the resource investment to fully leverage.
Hopefully, that example helped show how you can use the VMMM to get ideas on how to move your program forward. And if you haven’t had a snack by now, I commend you. Your will power is stronger than mine.
The last way I will outline how the information on the poster can help your program out is metrics. Yes, those little pieces of information that can either help your program convey great pieces of knowledge quickly or can cause great annoyance by all the questions that they generate from people looking at them. On the lower right-hand side of the poster, there is a section titled Vulnerability Management Metric.
In this section, we gave a brief description of the types of metrics that are important to the program. These metric categories are Contextual, Operational, Program, and Executive. Do the metrics you produce cover all of these areas?
Two main factors with metrics, in my view, are the following: What are you trying to convey, and who is your target audience. It doesn’t make sense to send the Executives the details on the newly opened vulnerabilities within Linux, nor does it make sense to send the Linux administrators the overall vulnerability risk for the finance business unit. Neither is actionable by the individuals that it was sent to. Reverse them and it is useful and conveys information that they need to know and can possible action.
If you want to move the program forward, start tailoring the metrics that you produce to the audiences you have. Two ways you can do this. One is to create some metrics and send them out and see if they are helpful to people. The other is to look at who the program is working with and then go talk to them. Yes. Have a conversation.
But be prepared for the answer of “I don’t know what would be helpful”. I have found that people tend to be able to answer the question if you have examples to show them (they are also very good at saying that this metric is useless). So spend some time thinking about what you think the program could give to a specific partner, and create some examples. They won’t be perfect, but it will give a discussion point.
And start small in any case. You cannot do it all at the beginning. It is better to have a few great metrics than a bunch of useless ones.
Add in trending when you have the data to do so. I find trending helps answer some of the questions that always come up. Shows the progress over time and tells the story of how things compare to previous months. Put in the policy upper and lower bound lines, and it is easy to see compliance information. An example of what I am referring to is below.
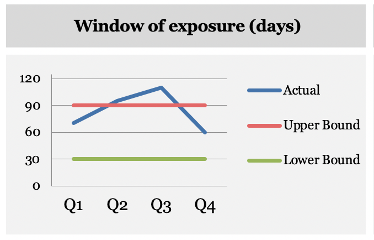
A quick way to see where the organization is at, and where we have been over the past 4 quarters.
Hopefully, this has given some useful insights into the maturity model. The goal was to show how you can leverage the information to gather ideas on how to advance your own program and I hope I have been a useful guide/mentor for the voyage.
Like Hans Solo.
I guess that would make you Chewie.
And since you didn’t get that haircut I mentioned last time, you REALLY do look like a walking carpet.
RRWWWGG.
About The Author
With a career spanning over 20 years that has included working in network design, IP telephony, service development, security and project management, Jonathan has a deep technical background that provides a wealth of information he draws upon when teaching. Currently, Jonathan works for the Canadian Government conducting cyber security research in the areas of vulnerability management and automated remediation. He is also an independent security consultant. Jonathan is a co-author and instructor for SANS MGT516: Managing Security Vulnerabilities – Enterprise and Cloud, and has been an instructor for both SEC504: Hacker Tools, Techniques, Exploits, and Incident Handling and SEC440: Critical Security Controls: Planning, Implementing, and Auditing. Read more about Jonathan here.
*** This is a Security Bloggers Network syndicated blog from SANS Blog authored by SANS Blog. Read the original post at: http://feedproxy.google.com/~r/SANSForensics/~3/h4dQmp2lRGs/vulnerability-management-maturity-model-part-ii
