

Automating ATT&CK Testing with SOAR and Atomic Red Team
MITRE ATT&CK is the defacto framework for organizations to measure their defense posture. ATT&CK provides categorical verticals in the form of tactics, which align to the common methodologies attackers use. Within these verticals are a set (and subsets) of common ways in which attackers accomplish a tactic (vertical). These are known as techniques.
Some techniques may be common across multiple operating systems. This usually equates to a broad definition of a technique. As defenders, this means we must understand how a single technique may be implemented on multiple platforms—which can be difficult for many, including myself. Luckily, organizations like Red Canary have provided our community with a rich framework to assist with the testing of these techniques.
Red Canary open-sourced the Atomic Red Team project several years ago to assist the security community by providing a set of Atomics (tests) mapped to the MITRE ATT&CK framework. Each Atomic is mapped to a specific technique within ATT&CK and provides one or more tests, which can be run on a system. These Atomics are intended to mock or emulate how an attacker uses a technique against your environment.
In addition to providing a set of tests that can be run, Red Canary also provides multiple execution frameworks that enable us to run these tests. These frameworks are written in Python, PowerShell (Core) and Ruby, but by far the most up-to-date (and most active) is the PowerShell (Core) framework. As a side note, I rewrote the PowerShell framework back in September of 2018, but it has had many changes since then.
The idea is that you would use one of the execution frameworks to run one or more Atomic tests against a system. In return, your EDR, SIEM, etc. would then trigger alerts/detections and begin measuring your effectiveness against specific techniques within your environment. However, doing this has proven to be a difficult, tedious and time-consuming manual process.
As a longtime fan of Red Canary and their Atomic Red Team project, I set out with two main goals:
- To invoke tests remotely across multiple operating system types using a single framework.
- To associate detections/alerts with Atomic tests within an environment.
I recently presented on how I was able to accomplish these goals using Swimlane SOAR. Additionally, I wanted to give back to the security community by open-sourcing a component of this use case.
Use Case
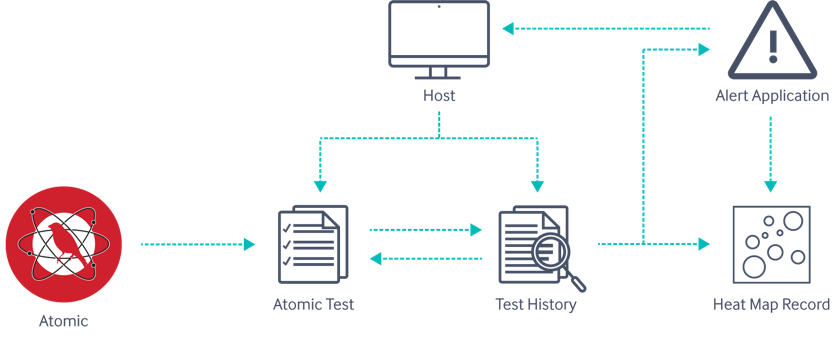
The main use case consists of several applications within a single workspace. I was able to parse out Atomic Red Team Atomics into a single record within an Atomics application. As I mentioned previously, each Atomic may have multiple tests associated with it, and those tests may not be for a single operating system type. So, I created a secondary application called Atomic Tests, which holds the details about each test and is associated with the Atomics parent record.
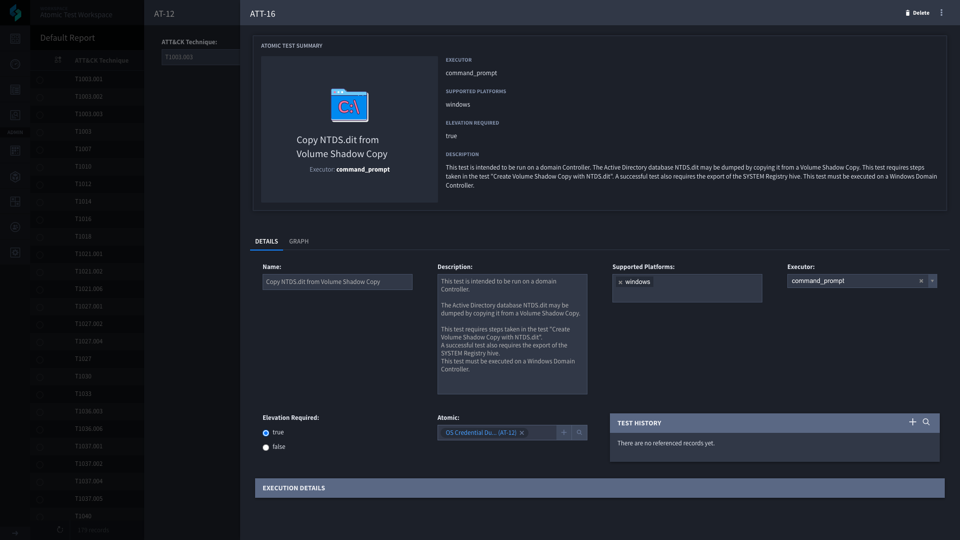
The main entry point an analyst would use is the Host application. The host application contains information about a host in which you want to run a test against. An analyst will create a record and provide (at minimum) a name, address (IP or DNS), and the operating system type. Once this new Host record is saved, an analyst needs to choose which tests they would like to run. They do this using a reference record to the Atomic Tests application. Once they have added tests, they can choose to run one or more tests associated with the record.
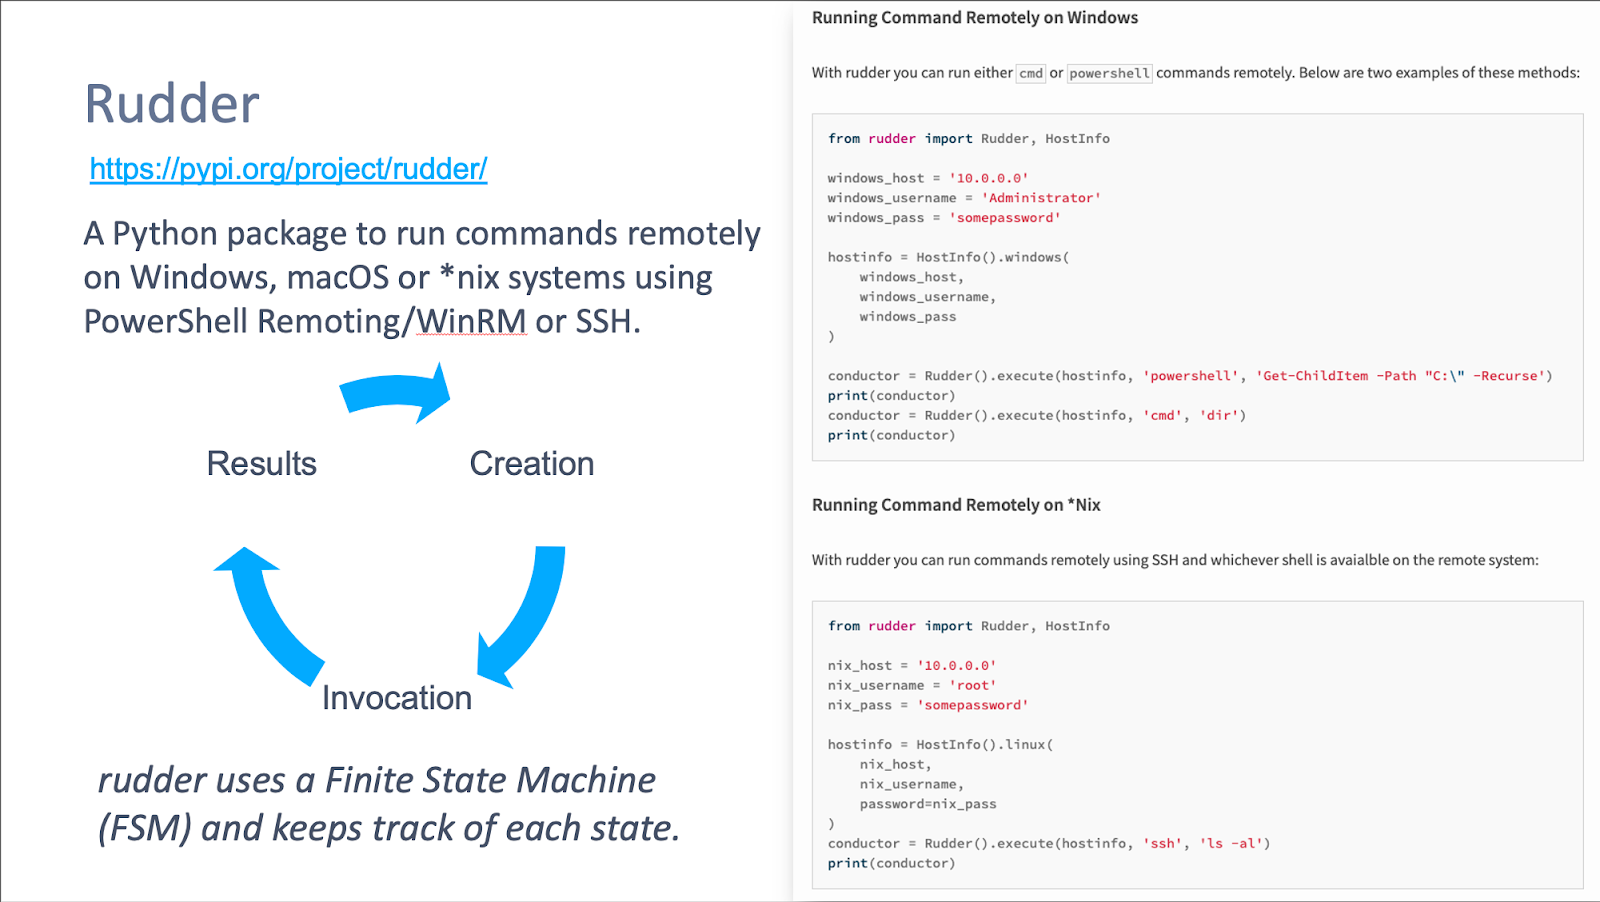
rudder
You may be asking, “How are they going to run these tests remotely?” Well, I would like to introduce a new open-source tool called rudder. rudder is Python package that remotely executes commands on Windows, macOS, or *nix, and it is cross-platform.
In order to use rudder, you must provide it with a set of credentials that can either utilize PowerShell Remoting/WinRM (Windows Remote Management) or SSH on the intended host.
Once you have provided a set of credentials within our Keystore, you can run tests across multiple hosts on multiple operating systems from Swimlane. For each test run on a host, we create a historical record in another application called Test History. This application contains records of every test performed on a host along with the system’s response. Each of these tests are then associated with the Host it was run on, providing historical contextual information.
Once a single test has been run on a host, we immediately begin to search for incoming alerts/detection, which are similar to our test. We do this by looking at the provided applications and specific fields to monitor. We also take into consideration the following data points when making a determination (all of these can be easily modified or customized to your organizations needs):
- Timestamp comparison
- Searching start times are based on the timestamp the test was invoked on the host
- The end duration is configurable, but by default we have kept it to 3 hours since the test was run
- Address comparison
- We look at the provided fields and check if the alert host name/address is the same address the test was run on.
- Execution comparison
- Normalization of Atomic test and alert details
- Lowercase
- Remove characters (e.g. |, \\, etc.)
- Compare two command lists to find percentage difference between similar strings and values.
- Optional:
- We gave the capability of using Levenstein distance calculations and SSDeep hash comparisons, but these are costly and are better used with similar source & destination values.
- Normalization of Atomic test and alert details
Once a comparison has been made, and we have determined that an alert/detection is similar to our test, we then associate that alert record to our single test history record. At this point, we either create a record or associate our test history record with another application called Heat Map Records.
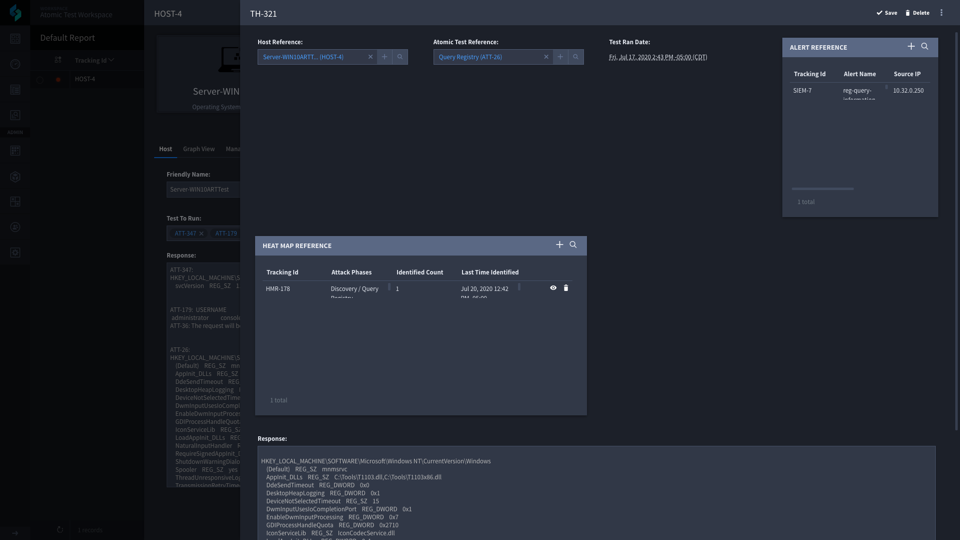
A Heat Map Record is used to track, report and display data about our ability to detect (or not) specific techniques in which we have run tests. If a test was run and no Alert was identified, then we still track this event, but our reporting will be a little different than if we were able to accurately detect a technique across all historical tests.
Once these records are created or a test history record is associated with a technique, we can then visually understand where we are able to detect malicious activities and where we are falling short.
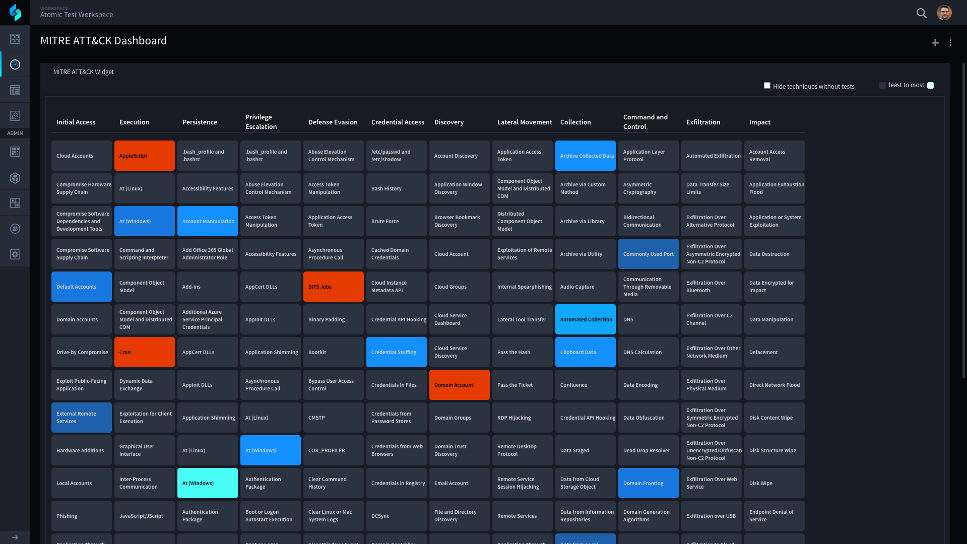
Above is an image of Swimlane’s MITRE ATT&CK Dashboard widget. This dashboard is pulling data from our Heat Map Records and displaying it dynamically. If a grid box does not have color, this means we have not run tests for this specific technique. The darker blue means we have run at least one test and have been able to detect it. As more tests and detections are identified, the color lightens to the aqua blue around At (Windows). If a test has been run and no detection was identified then that technique will be red.
By using Red Canary’s Atomic Red Team and Swimlane SOAR, you can automate your ATT&CK testing while gaining visibility into your detection capabilities and gaps simultaneously. No more manual testing, review and correlation. With this use case, you can identify gaps rapidly and begin retesting within a few minutes.
*** This is a Security Bloggers Network syndicated blog from Swimlane (en-US) authored by Josh Rickard. Read the original post at: https://swimlane.com/blog/automating-mitre-attack-testing/
