

Investigate alerts in Microsoft Azure
Alerts or detections come in many forms—some are good and some are not—and security operations center (SOC) analysts are responsible for the initial investigation into these anomalies. What’s more, when it comes to cloud-based resources, we may not have the luxury of logging everything that happens on a host operating system.
Microsoft Azure helps provide quite a bit of data to assist with the initial investigation, as well as some initial response actions. If you are a tier-one or -two analyst, you probably don’t have the ability to perform a full investigation, which is typically completed by your incident response or digital forensics team. With this in mind, I would like to introduce Swimlane’s new Microsoft Azure Use Case for just this situation.
You can also check out our recent webinar “How to Expedite Security Investigations with Microsoft Azure and Swimlane.”
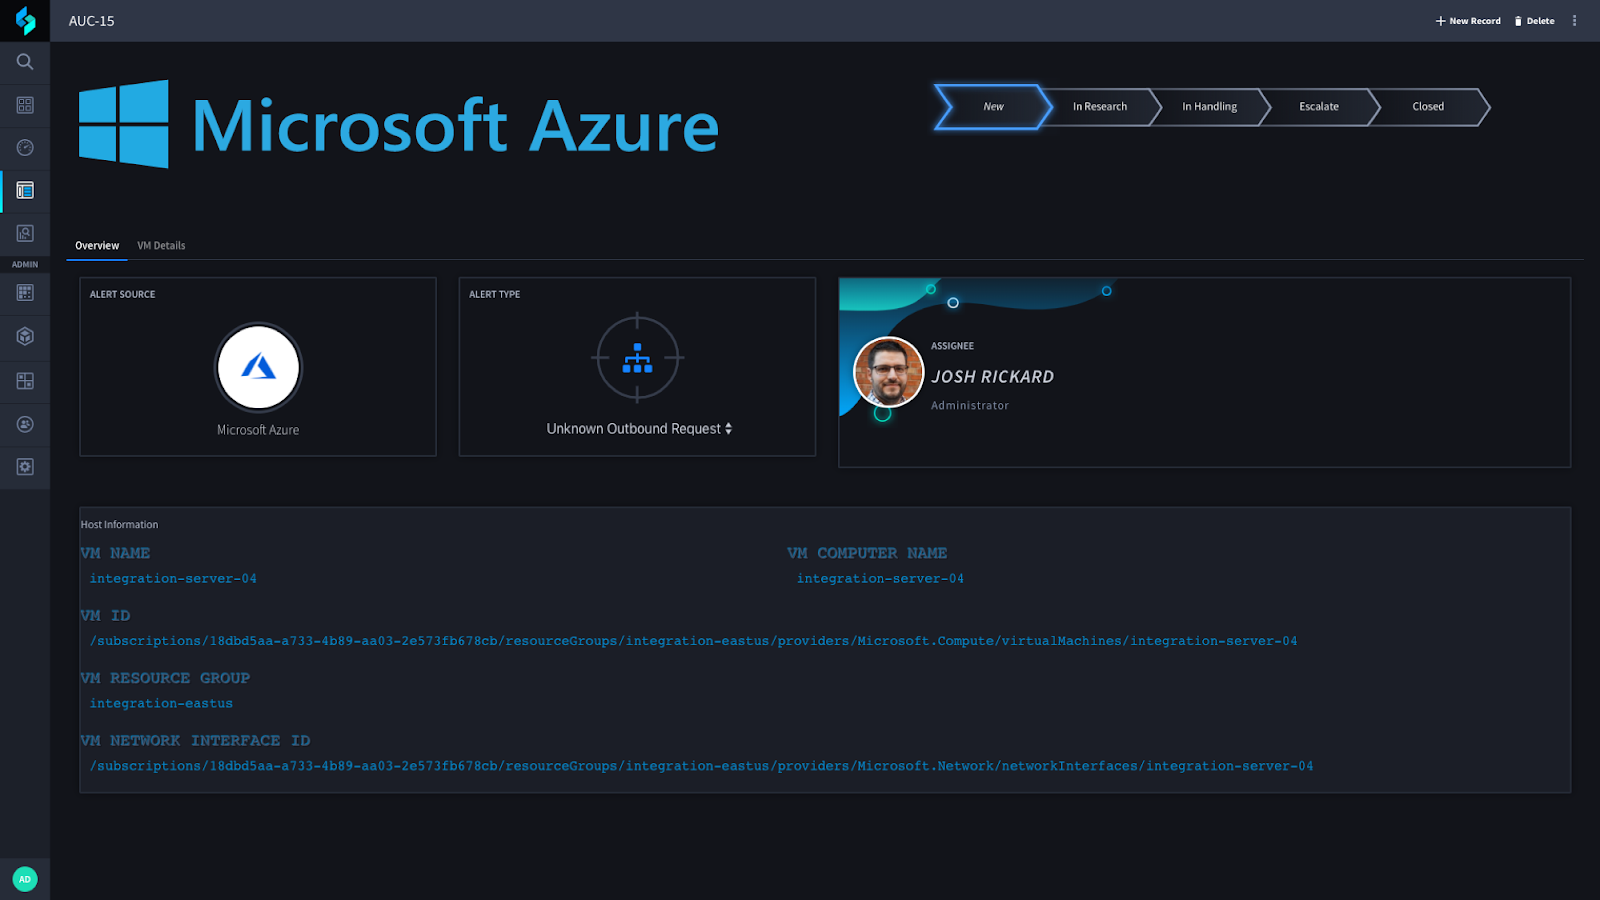
When an alert is received within our application, we first should gather information about the host system. In this example, we are using Microsoft Azure Computer VMs (Virtual Machines).
Viewing the record within Swimlane allows you to see the alert source and alert type quickly. Additionally, you can review the high-level details of the impacted system.
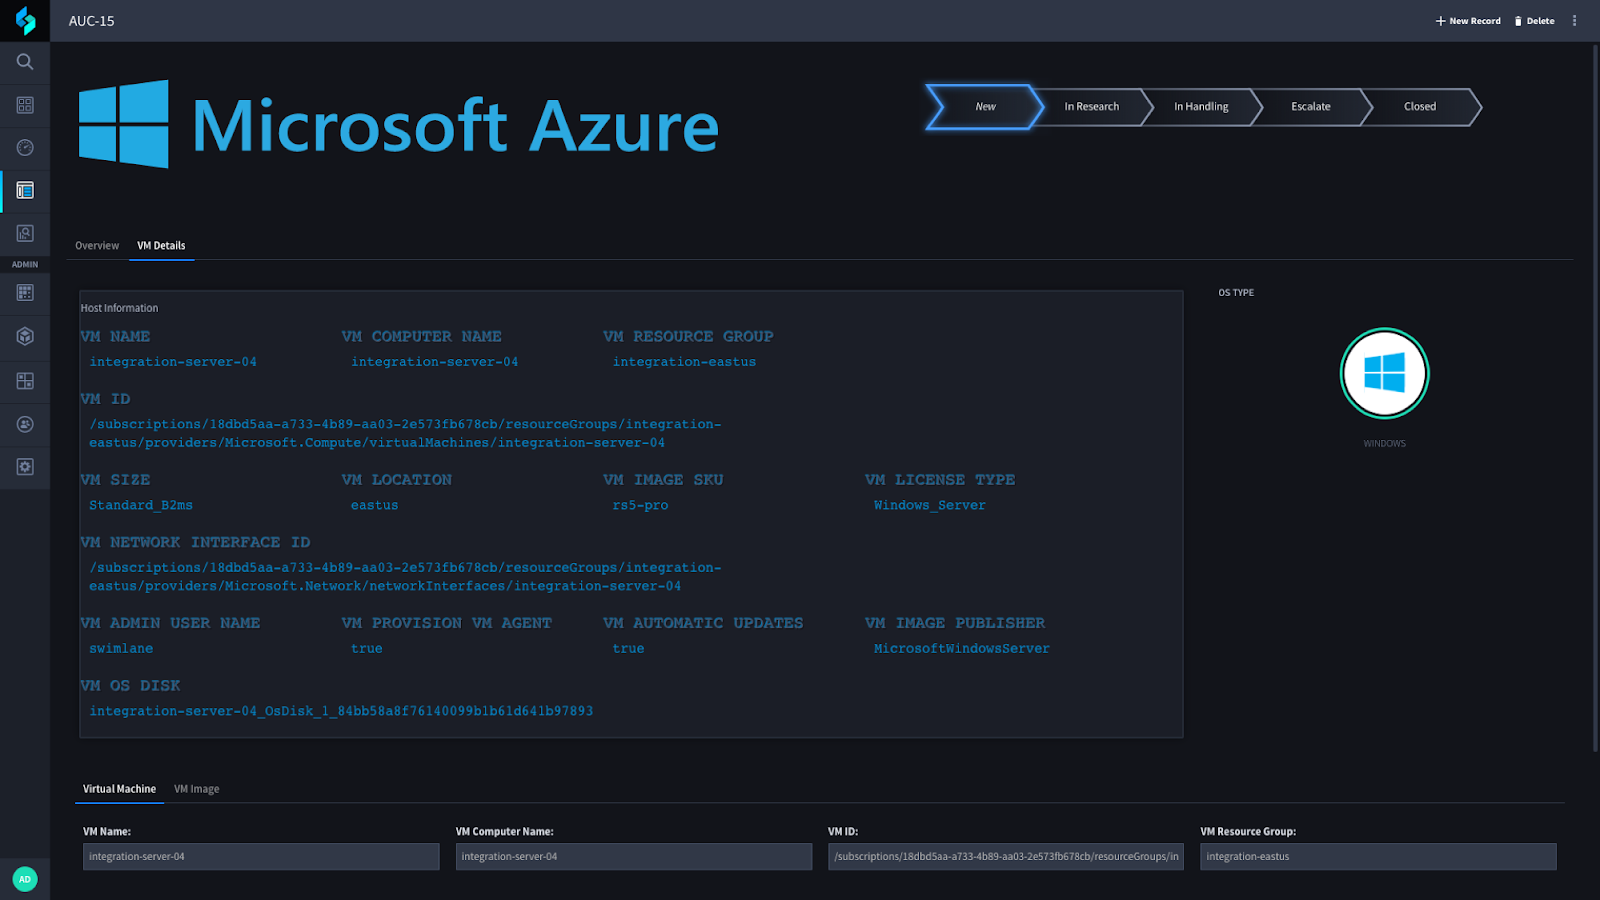
If we view the VM Details tab, we can see more information about this system. This information is critical to begin working in Azure and gives you context for the type of system you need to investigate.
Once you are familiar with the impacted resource, you can begin initial research about the system. When you select the In Research tab in our investigation phase widget, a new tab will be displayed next to VM Details called Research. Simultaneously, part of our defined workflow will begin to gather critical information about this system’s behavior and its network topology (more on this soon).
Swimlane will immediately begin gathering metrics about the system and generate visual graphs, which are uploaded to this record. You can then see these graphs to review and analyze the behavior of the VM.
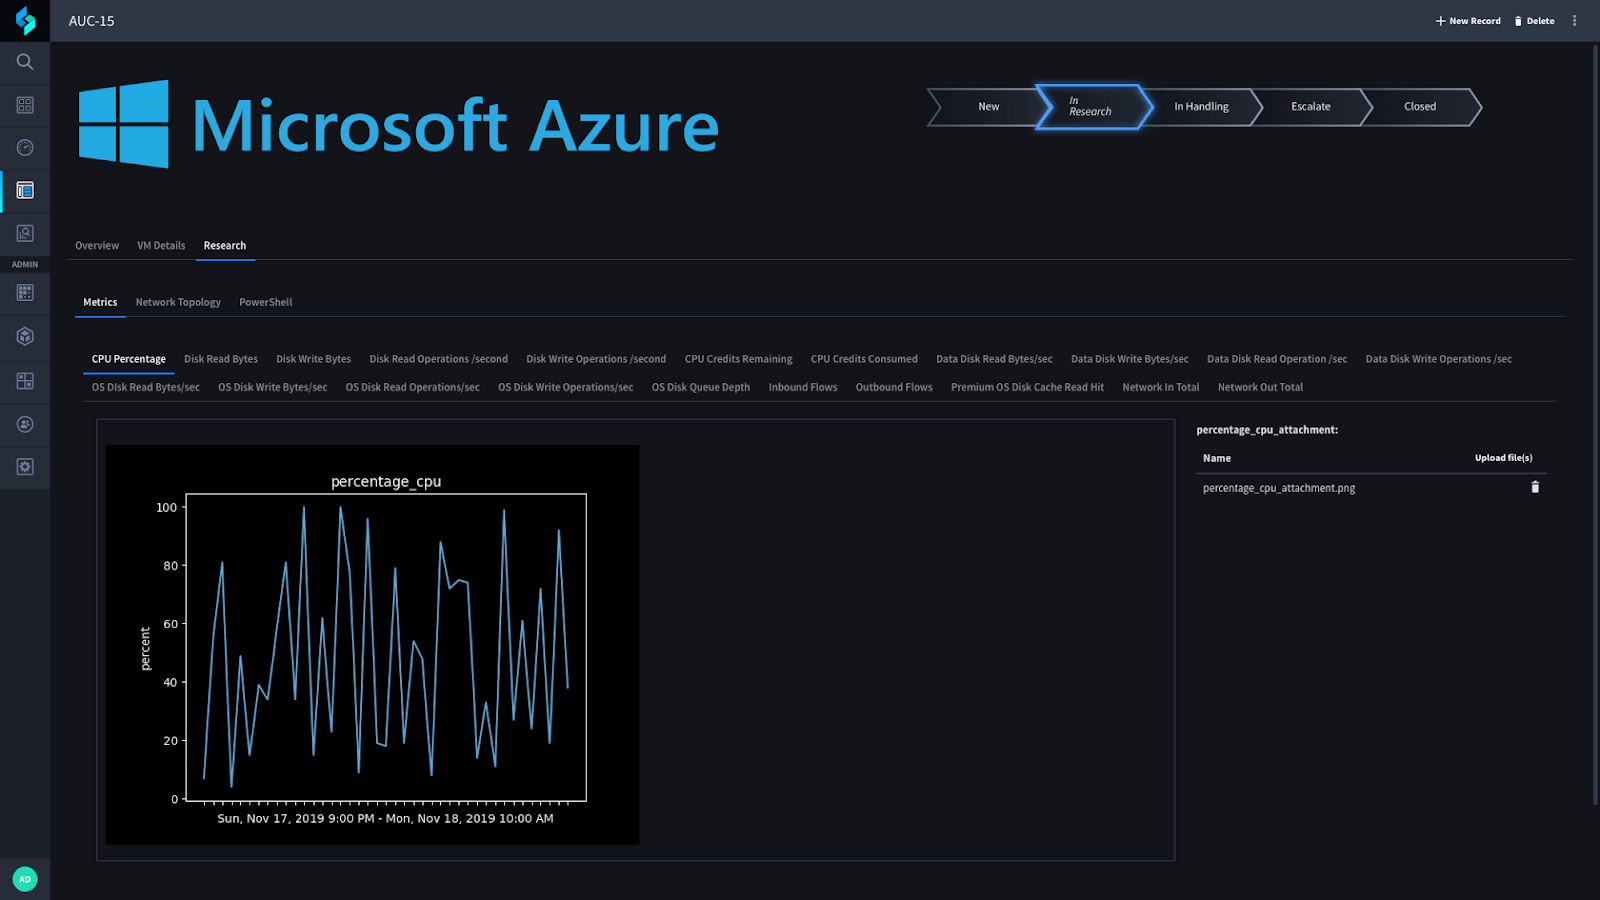
By using Swimlane and Python, you can get detailed metrics about a virtual machine such as the Percentage of CPU, Disk Read Operations per second, Inbound Network Flow, and Outbound Network Flow.
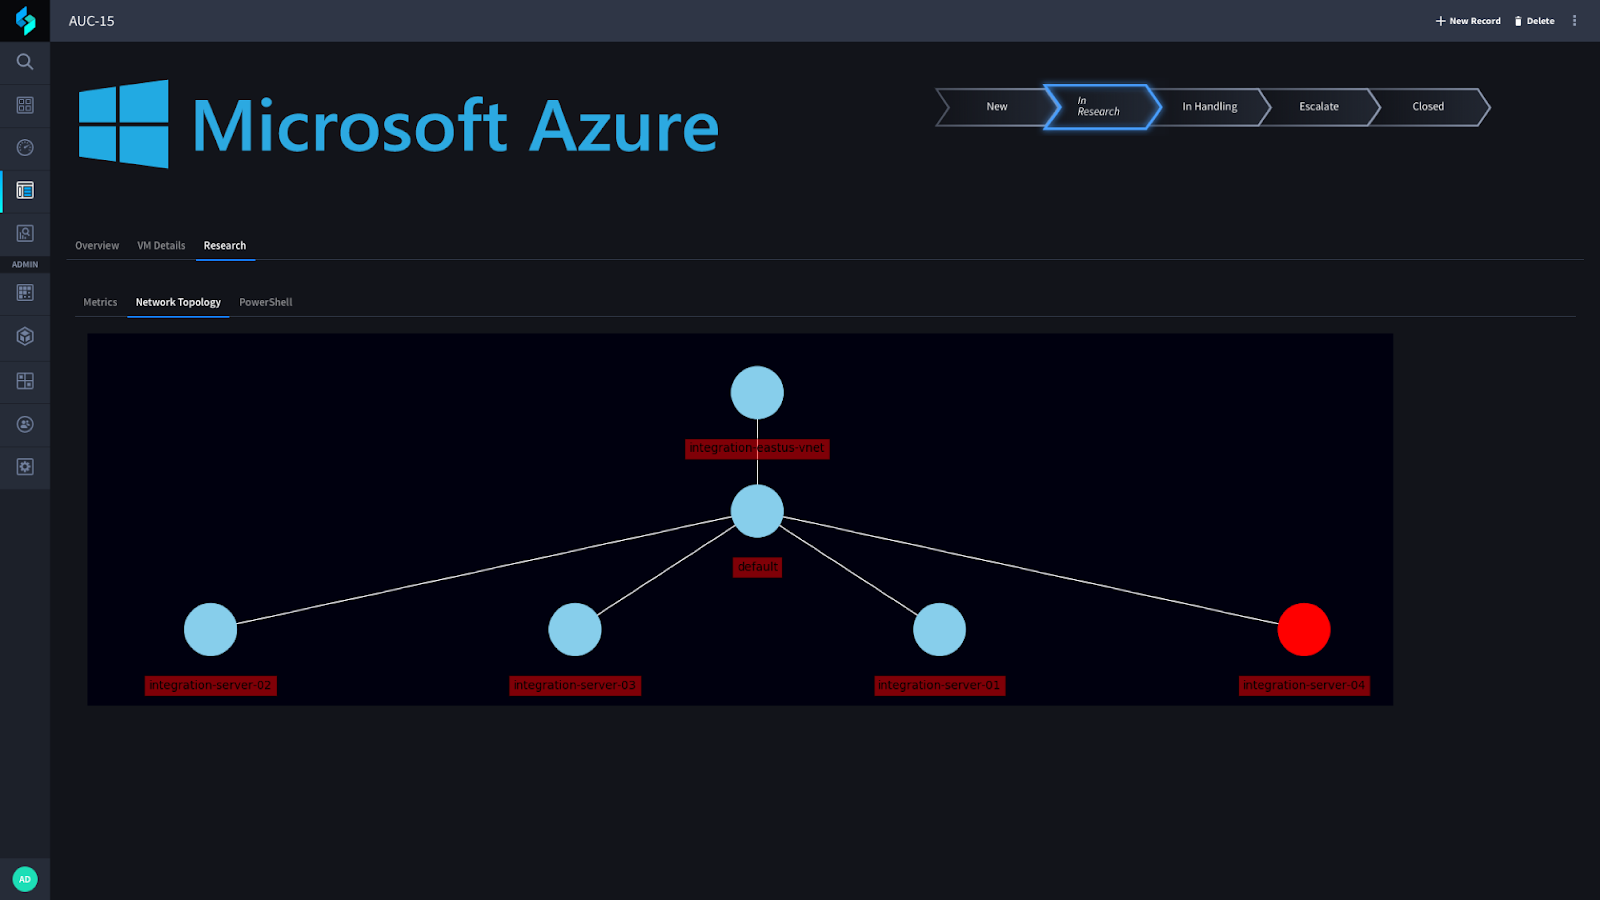
Additionally, Swimlane can generate a network topology map, allowing you to know exactly where the virtual machine resides and what other systems may reside within its subnet. In the screenshot below, you can see the Network Security Group (NSG) this virtual machine resides in (top node) and then any subnets associated with this NSG. All systems are seen under that subnet with the target (focused) system highlighted in red.
Finally, within the research section of this application, you can run PowerShell on the remote virtual machine using Azure REST APIs. Luckily for us, the Azure REST APIs provide a list of standard scripts that you can run on a system. These commands are:
- EnableRemotePS
- EnableAdminAccount
- IPConfig
- RDPSettings
- ResetRDPCert
- SetRDPPort
You can upload your own PowerShell script and run this using the Azure REST APIs as well!
Once you have finished your research, you may choose to close-out the alert or move on to the Handling phase. Within this phase, we support a lot of different functionality, including the ability to create a new Azure Monitor alert, create a new Azure Security Contact associated with an Azure Monitor Alert. In addition to these, we have added the capability of starting and stopping a packet capture.
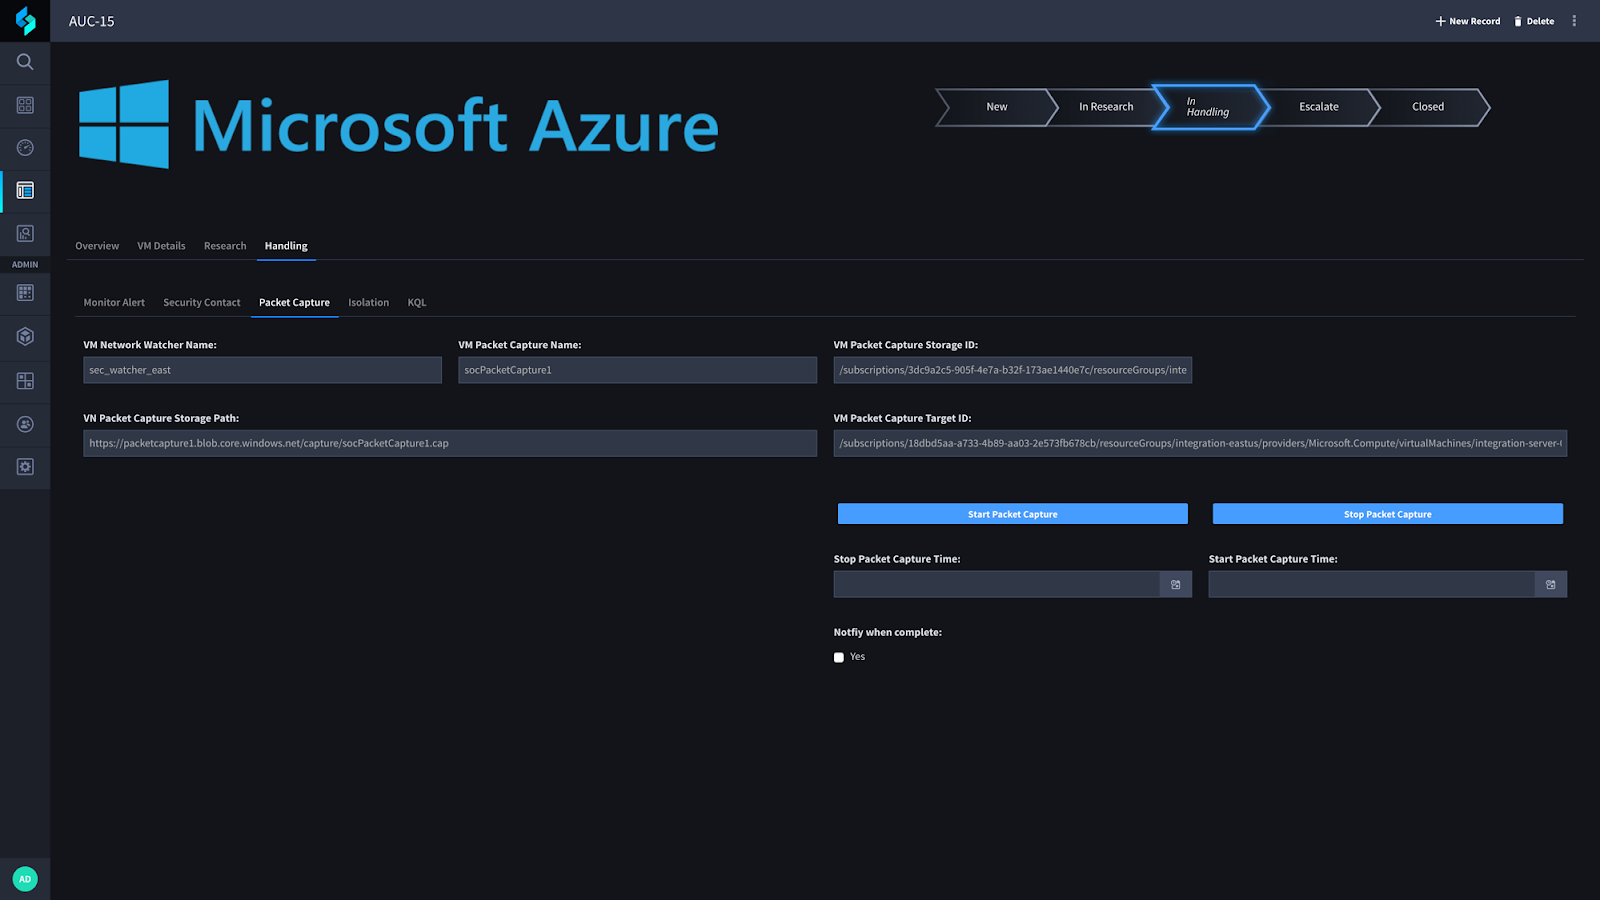
If you have been given the appropriate rights, you can start and stop a packet capture. And if you wanted to set a duration to start and stop the packet capture automatically, you can do that as well. We have also added the capability of sending a notification via email (but you could integrate with other services like Slack) to the intended recipient when it has completed and uploaded to the Swimlane record.
If you have reviewed and/or inspected the packet capture using either an API or using Wireshark (or some other similar tool) and have determined that they need to isolate this host to be sure before escalating to a more experienced analyst then they can do so on the next tab under the Isolation section.
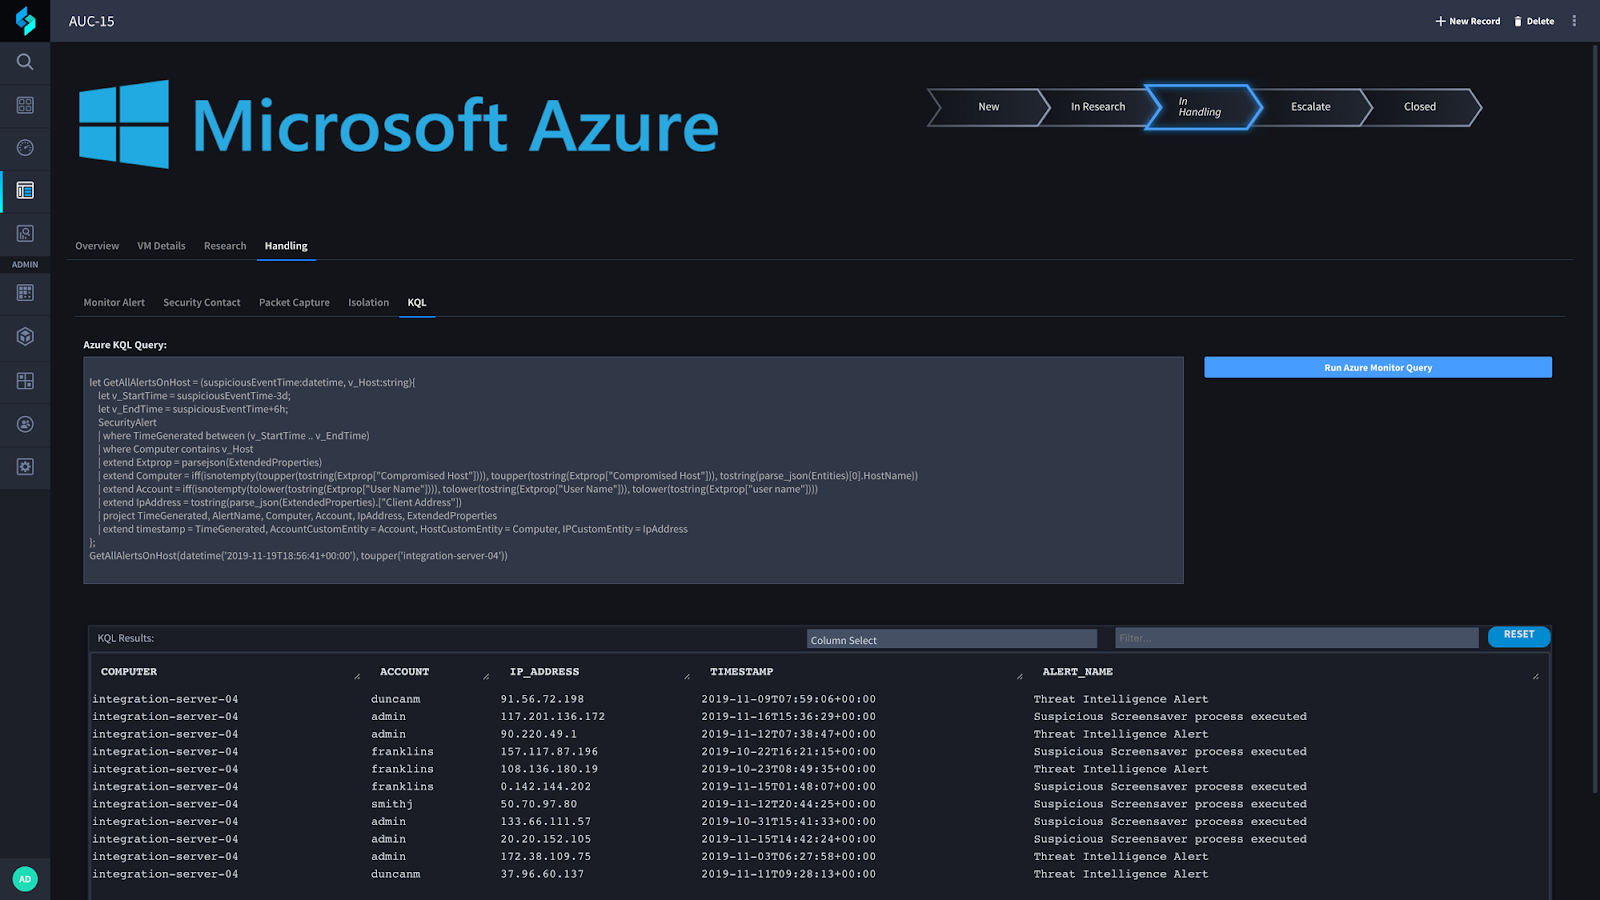
I also wanted to mention that we support querying Azure Monitor using KQL (Kusto Query Language). You can simply add default/template queries here or copy/paste another query into this field and run it against Azure Monitor. Once the query is complete, you should see the returned results in our KQL Results widget:
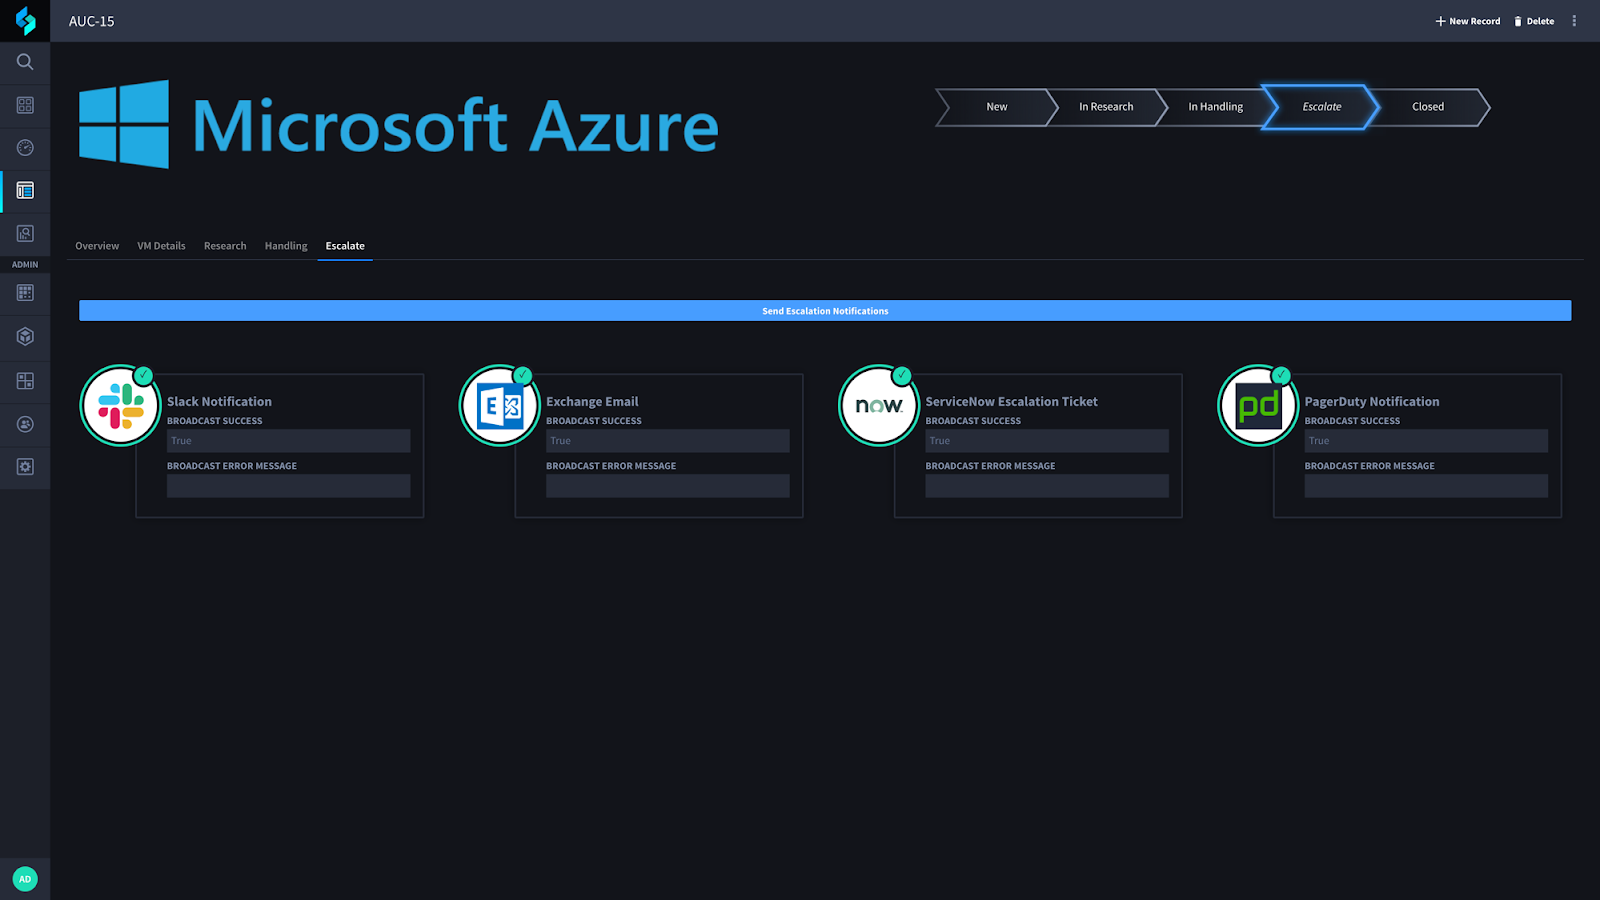
Finally, if you have determined that you need to escalate the alert, you can select the Escalate tab and broadcast a notification to multiple different sources (depending on your organization’s use of tools).
That’s it! I hope you enjoy our new use case with Microsoft Azure. And if you haven’t caught our webinar yet, check it out!
*** This is a Security Bloggers Network syndicated blog from Swimlane authored by Josh Rickard. Read the original post at: https://swimlane.com/blog/investigate-alerts-in-microsoft-azure/
