

Increasing Security Visibility with Multiple Custom Dashboards
At Signal Sciences, one of our guiding principles it to make security visible. That means empowering our customers to know what is happening at layer 7 quickly and easily without searching through log after log or screen after screen to answer basic questions: our next-gen WAF and RASP management console provides actionable web security data and KPIs for security, development and DevOps teams so they can proactively protect their web layer assets.
Our customers have had the ability in our management console to edit the dashboard found on each site’s overview page by adding custom signal time series graphs and rearranging the layout of those cards.
Now customers can create and edit multiple custom dashboards for each site to present data relevant to teams throughout their organizations. They have the ability to save multiple custom dashboards, each with their own name and card layout. Every card type is movable, including default cards like the Flagged IPs card. Owners, Admins, and Users can edit and view all of a site’s dashboards, and Observers can view them.
Fast access to relevant web app security data
This update enables different business units to use and maintain site dashboards with their own data. For example, a SecOps team, a DevOps team, and Business Intelligence team can each have their own dashboards. Or each user can even have their own dashboards. There has been a strong desire from customers to customize how they slice and view data, and we heard a lot of feedback from our annual Customer Advisory Board that teams across multiple departments want to use our console to view their data. This is a huge testament to the usability and design of our console and we’re stoked to expand its value beyond the scope of security teams.
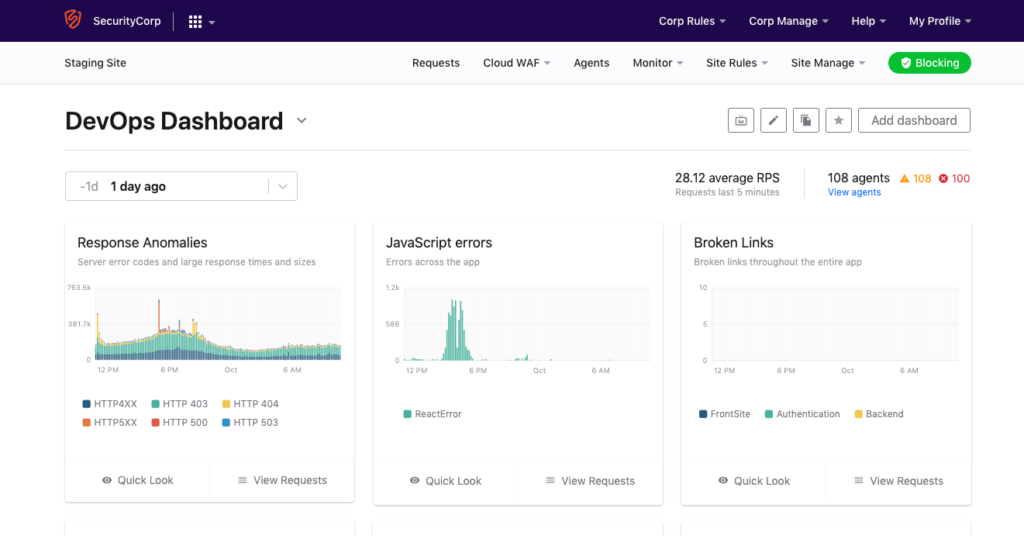
An example of a DevOps dashboard displaying 24 hours of response anomalies, Javascript errors and other KPIs.
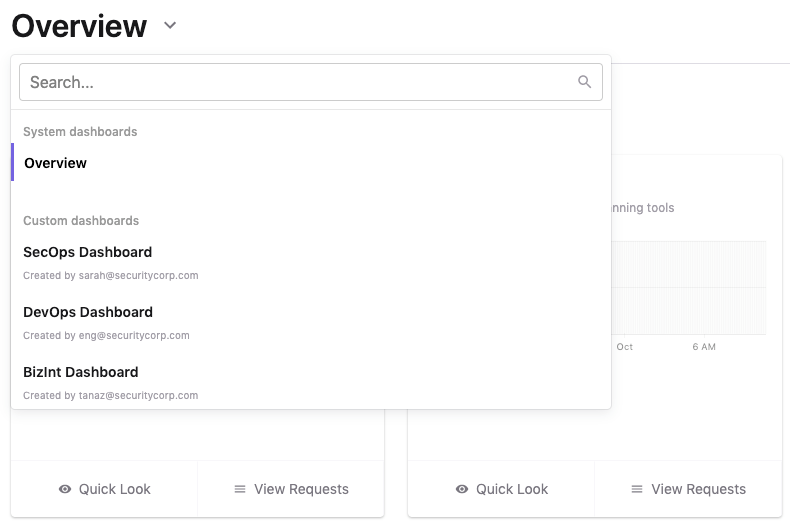
Various teams can quickly access their specific dashboards from a dropdown menu.
How to Add and Access Custom Dashboards
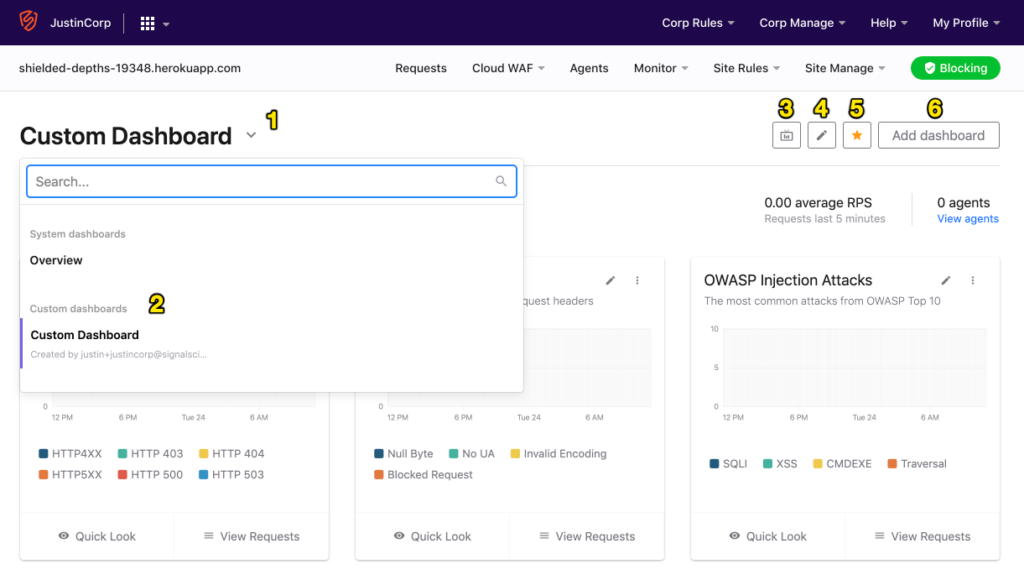
- Click the chevron to the right of the dashboard’s name to select and search for which dashboard to view by clicking
- The dropdown has two categories:
- System dashboards, which are created by Signal Sciences.
- Custom dashboards, which are user-created and accessible by all users assigned to a site.
- Note: The default Overview dashboard is still available under the “System dashboards” subheading.
- Each dashboard has its own Monitor View, each of which has an optional public URL, which may be useful if you need to share the dashboard with external stakeholders.
- Edit a dashboard’s name by clicking the pencil button
- Users can select a default dashboard by clicking the star button
- Users add a new dashboard by clicking “Add dashboard”Note: After this launch, you can access any previously created custom dashboards from the drop down menu, under the “Custom Dashboards” subheading.
The post Increasing Security Visibility with Multiple Custom Dashboards appeared first on Signal Sciences.
*** This is a Security Bloggers Network syndicated blog from Signal Sciences authored by Brendon Macareg. Read the original post at: https://www.signalsciences.com/blog/increased-security-visibility-multiple-custom-dashboards/
