

How ShiftLeft is able to analyze 1 million LoC under 15 minutes?
How ShiftLeft is able to analyze a million lines of code in just under 15 minutes?
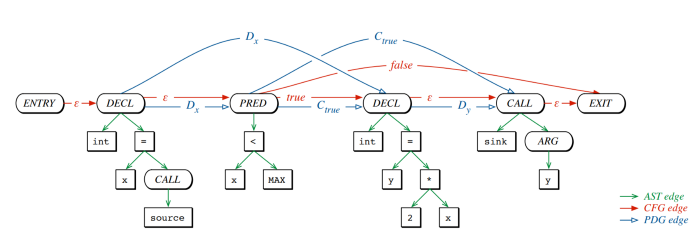
ShiftLeft code analysis technology uses a singular code representation “code property graph” to perform all types of analysis. This is unlike legacy SAST vendors that require creation and correlation of 6 to 7 types of code representations adding major time and memory cycles.
Let us start from the first question — Why speed matters?
Speed matters — It makes DevSecOps story real!
Imagine this scenario —
You are a developer who would like to fix security vulnerabilities as you are writing code. Here is your desired process-

- You write the code, initiate a pull request, build the code and as part of build process run unit tests and a static code analysis tool.
- Depending on code size and build complexity, you should normally get results in 5–45 minutes along with bugs discovered during tests.
- Based on the build security rules, must solve security bugs are auto-flagged before your code is allowed to be checked-in.
- You look at the bugs, fix them, check-in and validate your results again. Finally, you go ahead, rerun PR request and you are done.
Sounds too good to be true?
Unfortunately, For 99% of developers and security engineers, this never happens as legacy SAST tools take hours if not days to analyze code and generate tonnes of false positives. Hence, most SAST tools, for all practical purpose are run outside of the development process to avoid slowing down the development pipeline.
ShiftLeft for the first time in the security industry has broken this speed barrier. It can analyze the entire code within development time window of 5–45 minutes depending on the size of the code. This allows developers to integrate security analysis in their development process without slowing it down.
Why are legacy vendors slow in the way they analyze code?
Static analysis is usually performed with a variety of techniques and their results are combined at the end of analysis to deliver results to the end-user. Such techniques include one or many of the following, prominently Data Flow analysis, Control Flow analysis, Taint analysis, Lexical analysis, Configuration analysis, and Buffer overflow analysis.

Legacy SAST tools create different data structures to perform these analysis one at a time and then combine intermediate output to generate final results. This serialized nature of analysis necessitates hours if not days of work and is full of errors
How does ShiftLeft achieves such speed of analysis?
On the other hand, ShiftLeft first creates a singular data structure called code property graph (CPG). It then performs all of the above analysis on the entire code base (third party libraries, open-source code) through this singular data structure (code property graph) achieving huge time/memory efficiencies and in turn saving time on analyzing code.
ShiftLeft code analysis tools Inspect and Ocular can regularly analyze 1 million lines of code under 10–15 minutes vs legacy vendors that take hours if not days to perform the same analysis.
Quoting from the blog written by Fabian Yamaguchi (inventor of code property graph) and Chief Scientist at ShiftLeft:
The code property graph is a concept based on a simple observation: there are many different graph representations of code, and patterns in code can often be expressed as patterns in these graphs. While these graph representations all represent the same code, some properties may be easier to express in one representation over another. So, why not merge representations to gain their joint power, and, while we are at it, express the resulting representation as a property graph, the native storage format of graph databases, enabling us to express patterns via graph-database queries.
What are legacy SAST providers doing to speed up their analysis? Does it help?
They usually perform one of the two tricks and both of them result in poor quality of end results.
- Incremental Analysis — Incremental analysis is about only scanning a limited part of code based on the changes to provide results. This usually has a high error rate and SAST tools will force full analysis if more than some % of code has undergone change.
- Reduce scope of analysis — Some of the SAST vendors recommend switching off certain types of analysis to reduce the scope/depth of analysis. This results in inferior quality of end results and can generate large false positives.
Epilogue
ShiftLeft code analysis tools Inspect and Ocular can analyze your entire code base (custom code, open-source, and third-party libraries) in minutes. You can try out Ocular here and Inspect here
How ShiftLeft is able to analyze 1 million LoC under 15 minutes? was originally published in ShiftLeft Blog on Medium, where people are continuing the conversation by highlighting and responding to this story.
*** This is a Security Bloggers Network syndicated blog from ShiftLeft Blog - Medium authored by Alok Shukla. Read the original post at: https://blog.shiftleft.io/how-shiftleft-is-able-to-analyze-1-million-loc-under-15-minutes-d2655dfc0f92?source=rss----86a4f941c7da---4
