

Balbix’s Role-Based Dashboards: Reduce Risk at High Velocity
When you drive a car, you can look through your windshield to see the road ahead. With this visibility, it’s easy to anticipate slowdowns and see where you need to make your next turn. This is a lot harder if you drive in reverse, as the view is fragmented across your side and rear-view mirrors. You have to drive more slowly. You may miss things.
Security dashboards provide you with similar benefits to looking out your windshield as you ‘drive’ your security practice. On the one hand, a dashboard can help you fully and accurately understand your attack surface. On the other hand, a dashboard can help you and your team act on those insights, and prioritize the issues that security and IT teams should be fixing. Without a dashboard, risk owners struggle to do so effectively.
Ideally, dashboards are role-based and fit the objectives and responsibilities of each function involved in managing cyber risk.
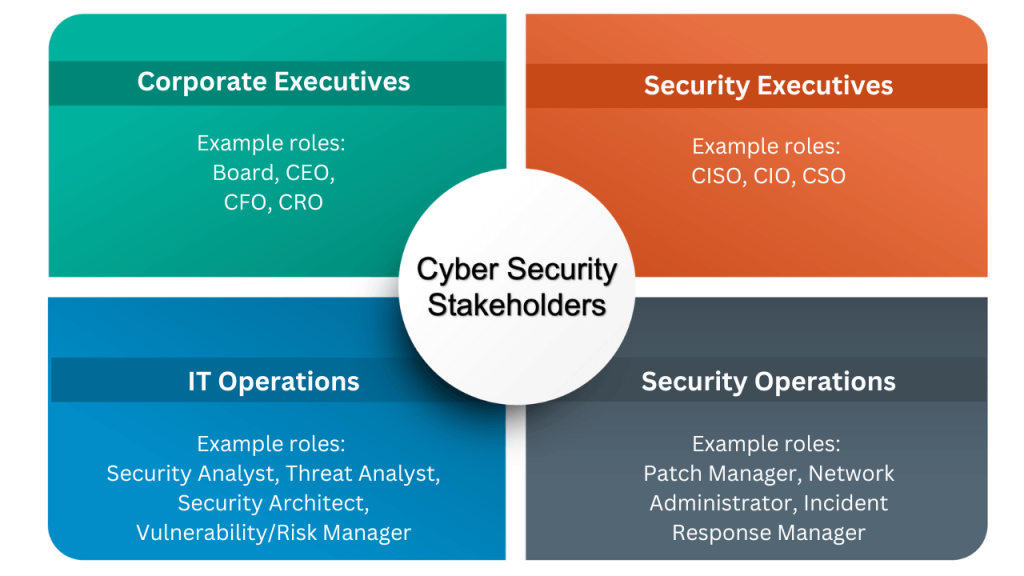
Cyber security stakeholders generally fit into one of four functions:
- Security Executives
- Corporate Executives
- Security Operations
- IT Operations
The image below outlines these functions within an organization.
Balbix dashboards
A core capability of the Balbix platform is to allow you to easily create stakeholder-specific dashboards. Balbix enables two general types of dashboards – operational and executive. The goal for executive dashboards is to provide security and corporate executives with big-picture visibility into quantified risk and key performance metrics to ensure that the right decisions can be made. For example, as a security leader, you may be looking to understand how cyber risk is distributed by line of business, geography or business owner. Executive dashboards also track the performance of the cybersecurity team.
The goal of operational dashboards is to help security and IT operations teams surface and prioritize the top security risks, provide all necessary research and technical context about those risks, and enable efficient and high velocity remediation of the risk issues.
Let’s look at these dashboards and examples of charts that might be included in a typical dashboard for each of these four stakeholder functions.
Balbix dashboard for security executives
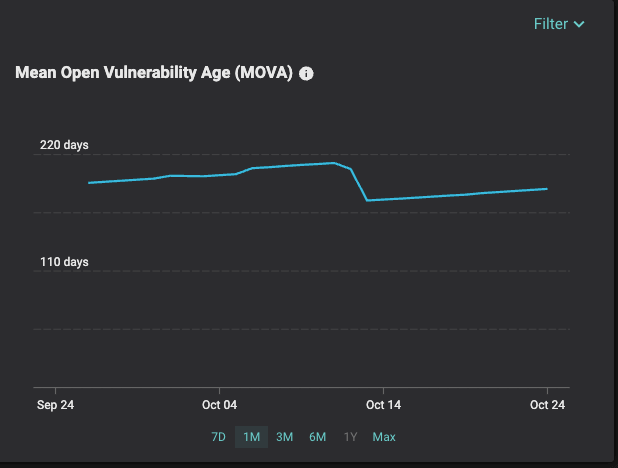
To oversee their cybersecurity program, CISOs need charts that track their team’s performance. With Balbix, CISOs can review metrics like mean time to patch (MTTP) and mean time to remediate (MTTR) that measure the effectiveness of operational teams when it comes to patching and remediation. To measure the average duration that vulnerabilities stay open from the time they are first detected, security executives can see their mean open vulnerability age (MOVA), as in the chart below. Tracking a metric like MOVA ensures that teams don’t lose sight of their vulnerability backlog and get distracted as new vulnerabilities come up.
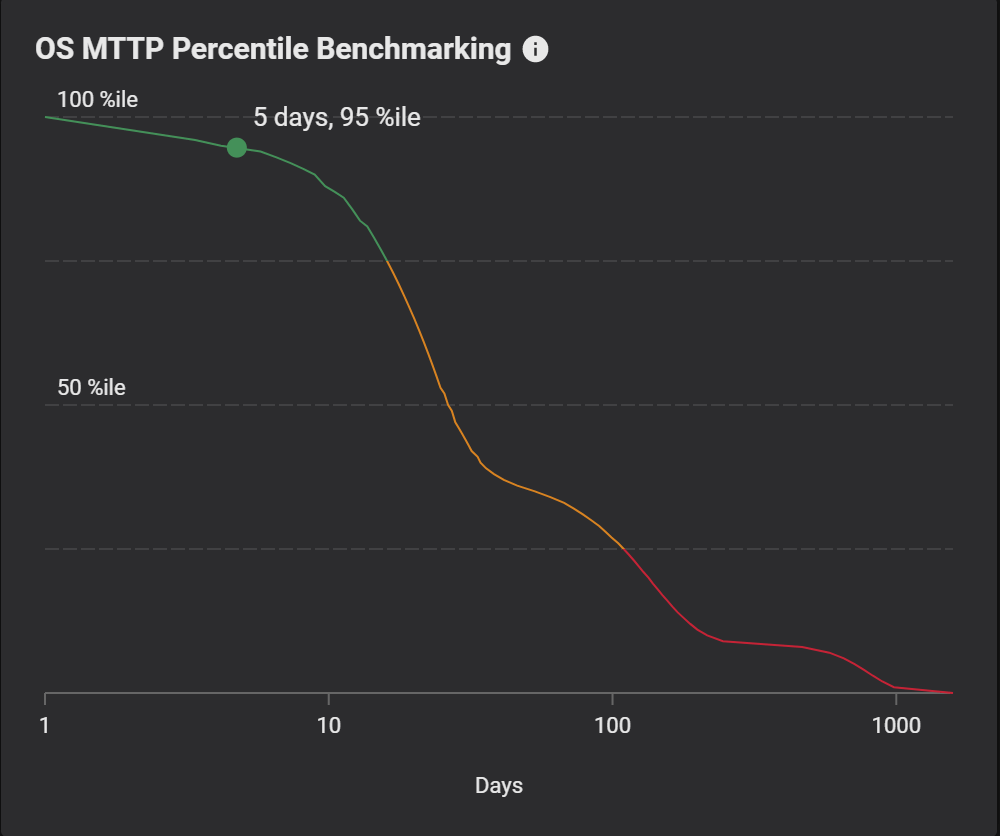
Balbix also allows CISOs to benchmark their security performance against other companies to get a measure of how well they are performing. For example, using Balbix, CISOs can see their ranking on a percentile-basis for operating system MTTP (see chart below).
The role of the CISO has also expanded from managing risk to communicating risk. To help CISOs do their job, Balbix provides a unified view of an organization’s security posture and visibility into the effectiveness of its security controls. CISOs can include charts outlining the overall state of their cybersecurity program in their own dashboard. They can also provide this information to corporate executives and board members in terms they understand and care about – dollars, or other local currencies – as outlined in the following section.
Balbix dashboard for corporate executives
A corporate executive’s perspective of risk is very different from that of an IT or security practitioner. An executive dashboard can drive budgetary decision making, help security teams gain support to change processes or make specific investments, and inform leadership about whether their organization is on track to meet its risk goals. Balbix provides charts that tie cyber risk to business outcomes by quantifying and communicating risk in dollars (or another local currency).
Typically, CISOs will include these charts in their own dashboard and then share them with CFOs, CEOs and Board members. Since these charts are continuously updated, CISOs can share near real-time insights at a moment’s notice or as part of a regular reporting cadence. If desired, CISOs can provide executive stakeholders with their own Balbix dashboard.
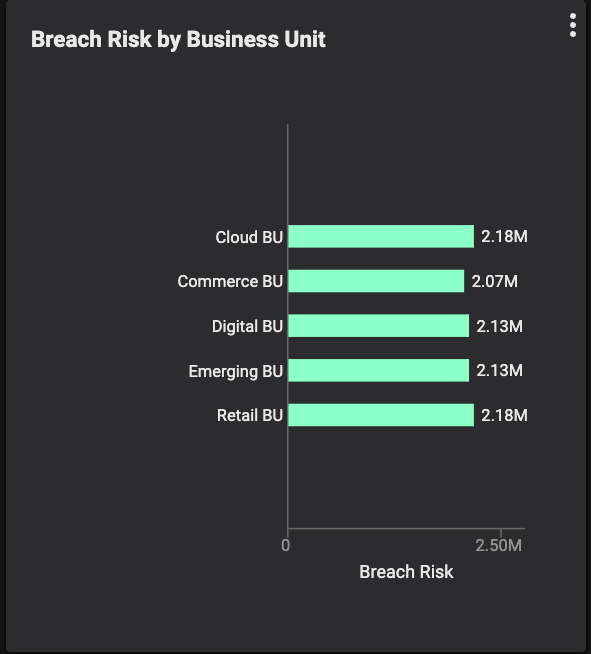
For example, as a security leader, you can build a chart like the one below that breaks down risk by business unit, in monetary terms. Your executive team can easily see which business units are contributing the most risk to the organization. Balbix allows you to view risk across your organization by business unit, geography, site, asset type, business owner, etc. Anyone can then drill down to inspect the underlying assets, vulnerabilities and mitigating controls that are driving the risk calculation.
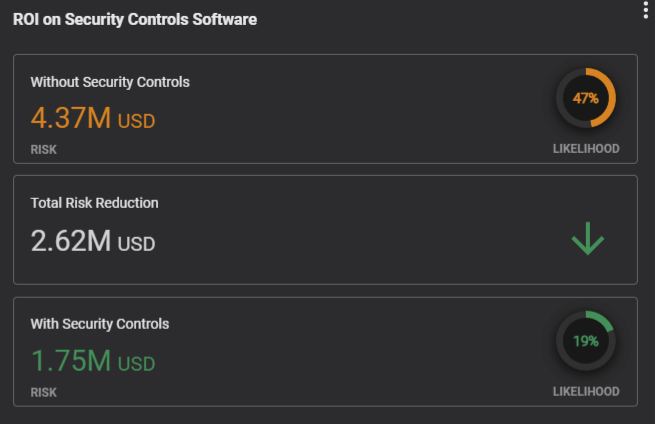
Balbix also provides charts that allow executives to calculate the ROI of existing or future security controls, such as an endpoint detection and response (EDR) tool.
Balbix dashboard for security operations
Members of the security operations team are like detectives; they investigate and surface weaknesses in your environment. When a vendor reports a new software vulnerability, it’s the operations team’s job to determine the risk that vulnerability poses to your organization and how to best to fix or mitigate it.
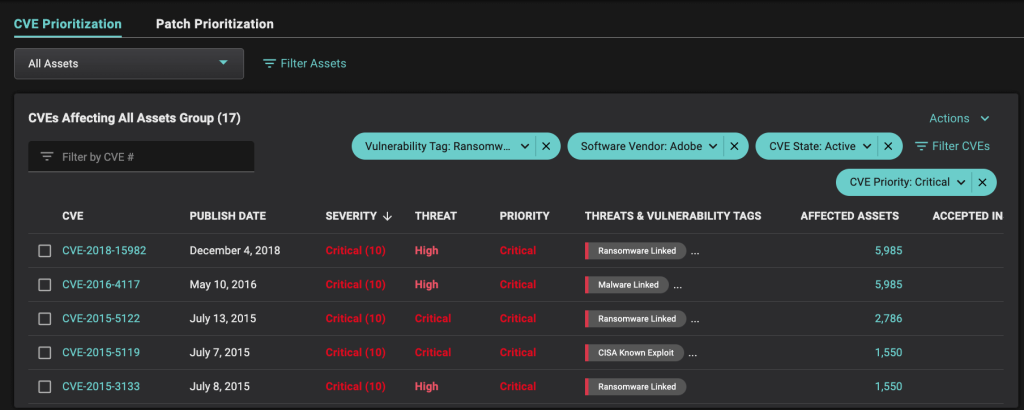
Balbix provides security operations with time saving features like patch prioritization and common vulnerability and exposures (CVE) prioritization to help them work efficiently. CVE prioritization allows security analysts to identify the riskiest issues requiring remediation, in near real-time. The security operations team can create custom charts in which vulnerabilities are prioritized, for example by CVE severity, threat level and overall priority. They can also use a wide variety of filters such as operational and business tags, threat name, and threat category (e.g. ransomware, ongoing exploits, available exploit code etc.), to further refine which CVEs to target for remediation.
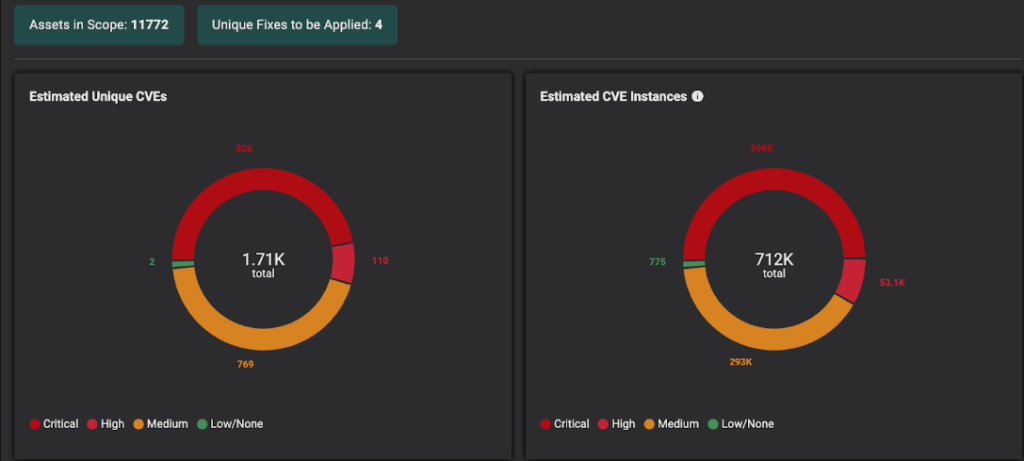
Patch prioritization on the other hand, allows analysts to take a patch-centric approach. Balbix identifies the patches that address the maximum number of open CVEs for all instances of an application deployed in your environment. Instead of remediating vulnerabilities one-by-one, security operations teams can use patch prioritization to easily identify and deploy fixes that quickly remediate high volumes of CVEs.
Balbix dashboard for IT operations
The IT operations team is responsible for correcting vulnerabilities in your network. They deploy patches and implement other workarounds to prevent a breach. Balbix provides the IT team with the specific remediation instructions they need to deploy fixes and near real-time updates showing if fixes were completed.
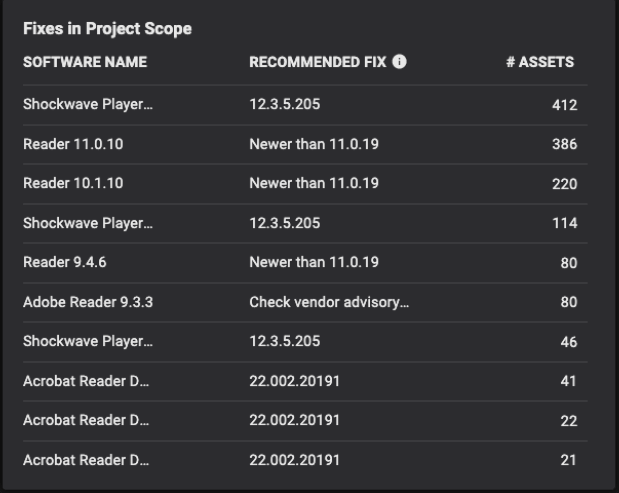
A Balbix dashboard helps IT teams remediate problem areas quickly. While other vendors often only provide a list of possible patches or upgrades that resolve a vulnerability, Balbix also recommends the best fix (see the chart below). IT staff also receive accurate remediation instructions about how to deploy the fix. As a result, they can spend more time implementing fixes and less time researching how to fix them.
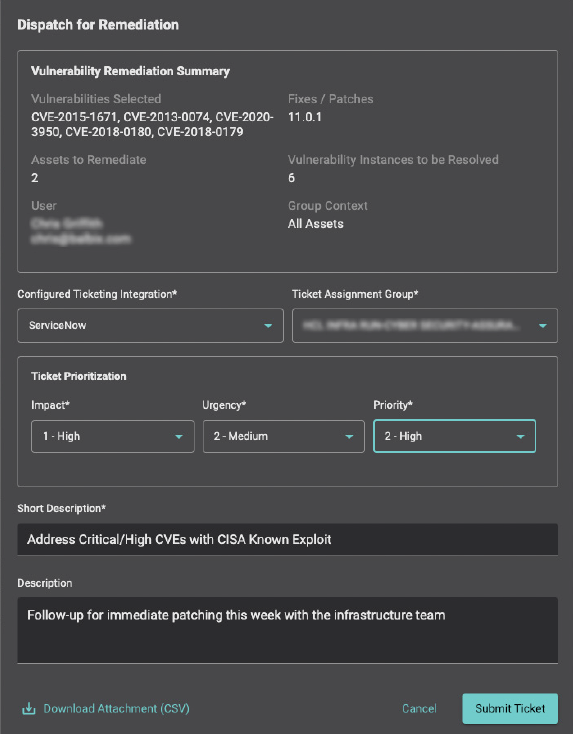
To improve productivity, Balbix also integrates with IT teams’ existing workflows. From their Balbix dashboard, your security team can initiate a service ticket (for example, in ServiceNow). Tickets list which fixes and patches to apply, specific assets to be remediated, and the number and priority of vulnerability instances to be resolved. As mentioned earlier, system administrators are automatically provided with clear remediation instructions.
The right information, at the right time
To recap, before building a security dashboard, it’s important to understand the responsibilities and goals of the person using the dashboard. A role-based dashboard can provide everyone – from IT operations to corporate executives – with the specific actionable insights they need to do their part in managing cyber risk. Balbix provides you with the flexibility to build both operational and executive dashboards to ensure that all your key stakeholders have the information they need to reduce risk at high velocity.

*** This is a Security Bloggers Network syndicated blog from Blog – Balbix authored by Chris Griffith. Read the original post at: https://www.balbix.com/blog/balbixs-role-based-dashboards-reduce-risk-at-high-velocity/
