

The LAPSUS$ Supply Chain Attack: Third-Party Playbooks and Detections
How to leverage third-party incident response procedures to detect threats using SIEM
Detecting fraudulent authentication and authorized activity is difficult at best. Many businesses face challenges when detecting fraudulent use of their systems by a third-party organization that has federated authentication and authorization within their company. That’s the challenge in supply chain attacks, or attacks that target third-party companies servicing other businesses; attackers use this chain of trust to compromise an organization through authenticated and authorized activity. There is no direct hacking or social engineering required. For more general information on supply chain attacks, please refer to MITRE ATT&CK’s “Supply Chain Compromise” (ID: T1195) technique.
Although this blog post focuses on LogRhythm technologies, the advice and guidance should be applicable to most security information and event management (SIEM) solutions. In this blog, we will cover how security analysts can use a third-party incident response procedure and apply it to LogRhythm playbooks and Case Management to utilize the playbook and collect log evidence. Then I’ll cover how to use third-party detection criteria and create LogRhythm AI Engine trend rules to detect suspicious activity. We will not dive into indicators of compromise (IOCs), but instead focus mostly on behaviors and actions that should be notable in most SIEMs.
I’ll start off by referencing a great Tweet by “Invictus Incident Response” (@InvictusIR) early on with the announcement of the possible OKTA compromise by Lapsus$:
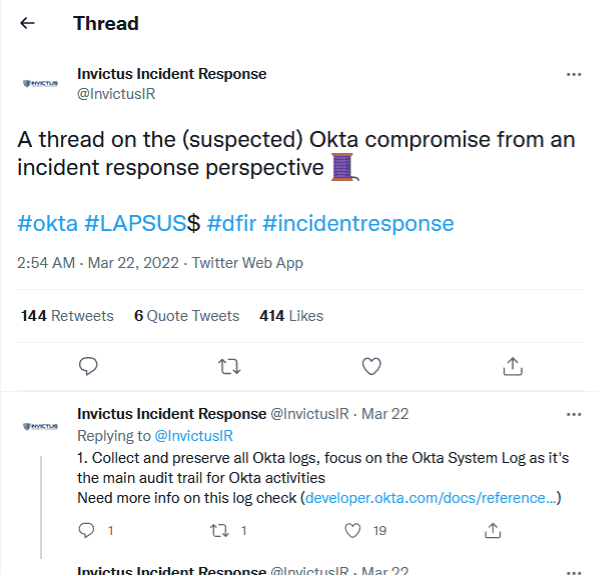
Figure 1: The Tweet is a series of incident response steps that can be taken by an analyst.
Threat hunting and incident response playbook by Invictus Incident Response: How to use the playbook in LogRhythm
LogRhythm technologies:
We recommend you review some of LogRhythm’s technologies before diving into playbooks.
- LogRhythm WebUI
- LogRhythm Case Management
- LogRhythm Playbooks
- LogRhythm SmartResponse™
- LogRhythm AI Engine
Creating the Invictus Incident Response Playbook in LogRhythm
When you need to perform an incident response procedure, LogRhythm has the ability for an analyst to create a playbook, and along with LogRhythm Case Management, collect evidence, measure and report on time taken, assign tasks to other security operation center (SOC) analysts, collaborate on the incident, and so much more. We won’t cover all capabilities of LogRhythm, but rather focus on the steps you can take for incident response to unusual third-party activity.
Creating the playbook
In the LogRhythm Web UI dashboard, start by using the Administration drop down and select “Playbooks.”
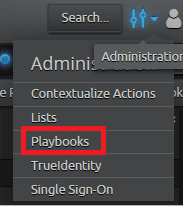
Figure 2: “Playbooks” tab.
Next, click the “Create Playbook” tab.
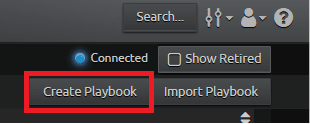
Figure 3: “Create Playbook” button.
It’s important to include detail and explain the purpose of your playbook; use fields like “Description” so that others know what the playbook is for, and how and when to use it. For example, this playbook is called “Incident Response: Invictus: Okta” with the description of “Invictus Incident Response procedure based on LAPSUS$ Okta attack, March 2022.”
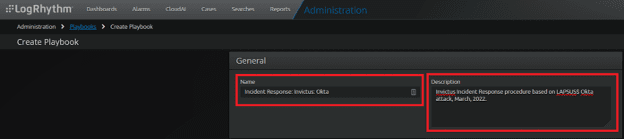
Figure 4: Create a descriptive name and description.
Before entering the procedures, fill out the remainder of the playbook including adding any Tags and setting the permissions as to who can view and edit the playbook. For example, the Tag “Incident Response” is added, and the permissions are set so that any analyst can view and work with the playbook, but only an administrator can modify the contents of the playbook.
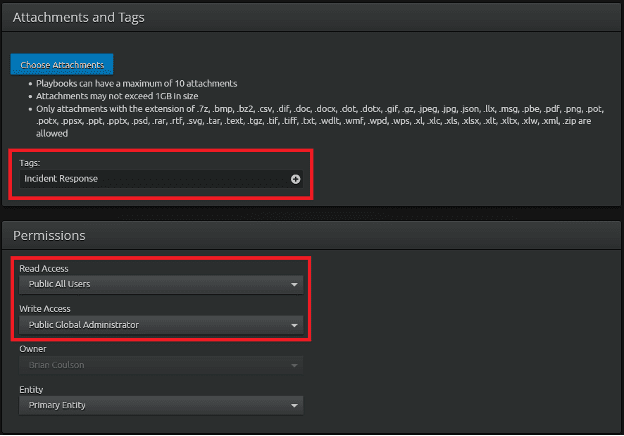
Figure 5: Add tags and select permission levels.
At this point, you may choose to “Save Playbook.”
Figure 6: “Save Playbook” button.
Adding procedures to the playbook
You can now add the procedures based on the incident response guidance to the playbook by clicking on “Add Procedure.”
Next, populate the “Procedure Name” field with the name of the first step as indicated by Invictus Incident Response. The easiest method is to copy and paste.
In the “Procedures Details,” again referencing from the Invictus Incident Response, copy and paste the full details of the step.
You can modify when the task is due based on any incident response agreements. For the purpose of this example, I’m setting the procedures to one hour.
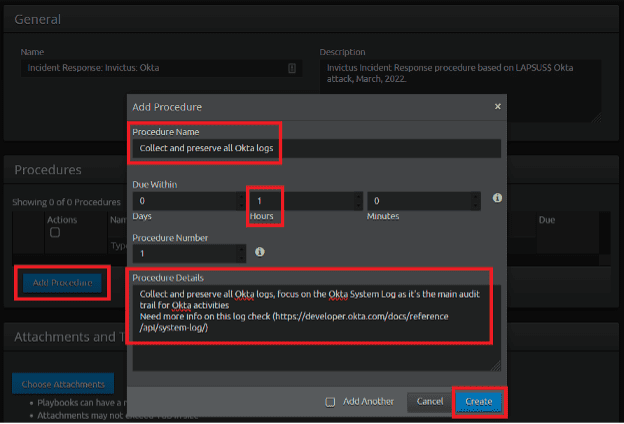
Figure 7: Setting up procedures to a Playbook.
When done, you may select “Add Another” before clicking on “Create” if you wish to add more procedures. There are more procedures to add from Invictus Incident Response, so in this example, “Add Another” will be selected and then click “Create.”
For the purpose of this blog, the creation of all six procedures will not be shown here. Once all the procedures have been added, click on “Save Playbook.”
Figure 8: “Save Playbook” button.
Using the Invictus Incident Response Playbook in LogRhythm: LogRhythm Case Management
Creating a new case in Case Management
First, click on the “Cases” tab at the top of the Web UI dashboard.
Figure 9: Click on “Cases” in the Web UI.
Next, click on “New Case” in the upper right-hand corner of the Web UI.
Figure 10: Click on “New Case.”
Next, populate the case fields with relevant information. For example, the name of the case would be, “Threat Hunt: Invictus Incident Response Okta Procedures,” and the summary would contain, “Performing a threat hunt based on Invictus Incident Response procedures.” Then click “Save” to create the case.
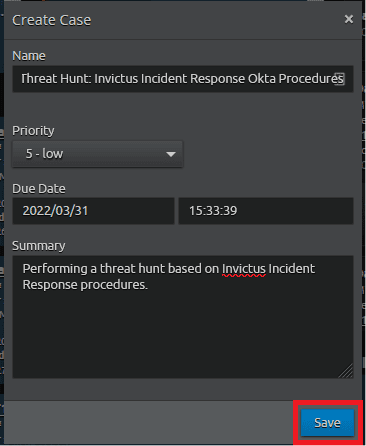
Figure 11: Populate case fields and click “Save.”
Next, click on the newly created case to pull in the playbook that was just created.
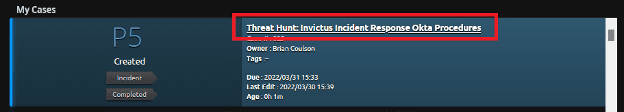
Figure 12: Click on the case name and add playbooks.
Add playbook to a case
Click on “Add Playbook” to add the Incident Response: Invictus: Okta playbook to the case.
Figure 13: “Add Playbook” button.
Once added, the section under “Playbooks” is ready to be worked. The playbook shows a quick overview of what the playbook is for based on the playbook summary added earlier, and shows the current procedures completed. In this case, 0 out of 6 procedures have been completed. Next, you can start working through the tasks of the playbook.
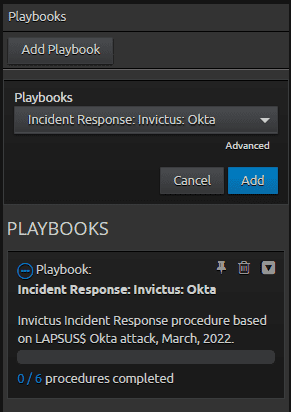
Figure 14: Playbooks widget.
In the Playbooks widget, you can see “Playbooks” where additional playbooks can be added to the case, the current playbook that has been added, and how many procedures have been completed.
Walkthrough of the procedures
Expanding the procedures
Click on the playbook name or use the drop-down arrow in the widget to expand the procedures.
Figure 15: Expanding the Procedures.
Procedure: “Collect and preserve all Okta logs”
Click on the down arrow of the “Collect and preserve all Okta logs” to reveal the procedural steps needed.
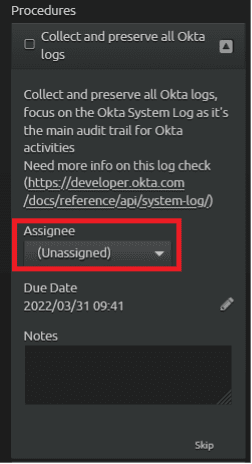
Figure 16: Assigning the task.
You can assign yourself the first procedure by using the “Assignee” drop down. Once assigned, the procedure hasn’t been worked since the playbook was added, thus the due time of one hour has elapsed and a warning is displayed that the task is past due. The due date can be modified to more accurately reflect when you were aware of this procedure. For the purpose of this blog, the past due flag will remain.
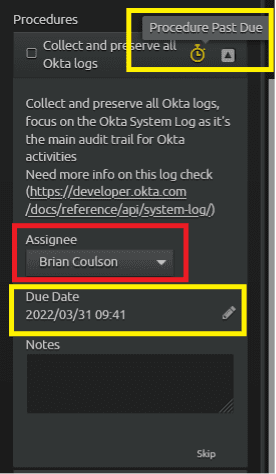
Figure 17: Assign procedure and modify “Due Date.”
Procedure One: Collect and preserve all Okta logs
Search for Okta logs with a focus on the “Okta System Log” as noted in the procedure. Based on Invictus Incident Response Tweet, it appears that Okta’s CEO made a public statement as follows: “In late January 2022, Okta detected an attempt to compromise the account of a third-party customer support engineer…” You now know that the starting point of the search should be from January to current.
In this example, click on “Search” in the Web UI and look back from January to current involving Okta log source, and User (Origin) [email protected] to search for relevant privileged accounts being used.
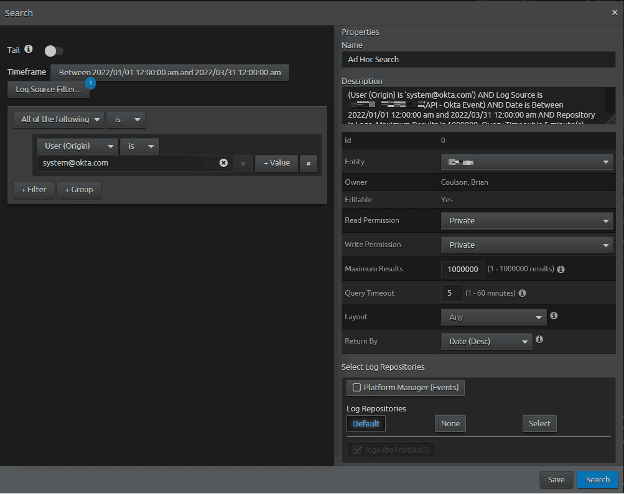
Figure 18: Ad Hoc Search criteria using the “Advanced” search. Selecting the time range, the log source type, the User (Origin), and returning the maximum amount of logs by Date (Desc).
Use this custom dashboard in LogRhythm Community to visualize Okta logs and help determine if suspicious activity has occurred.
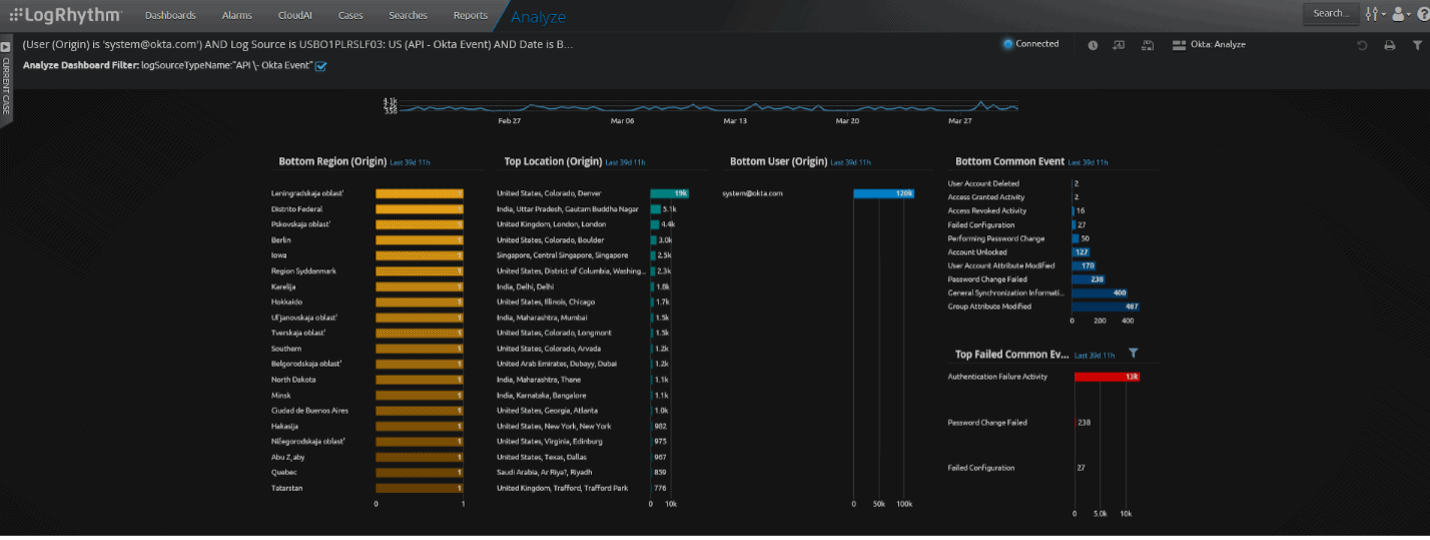
Figure 19: Custom Okta Analyze Web UI dashboard. Top section of the dashboard.
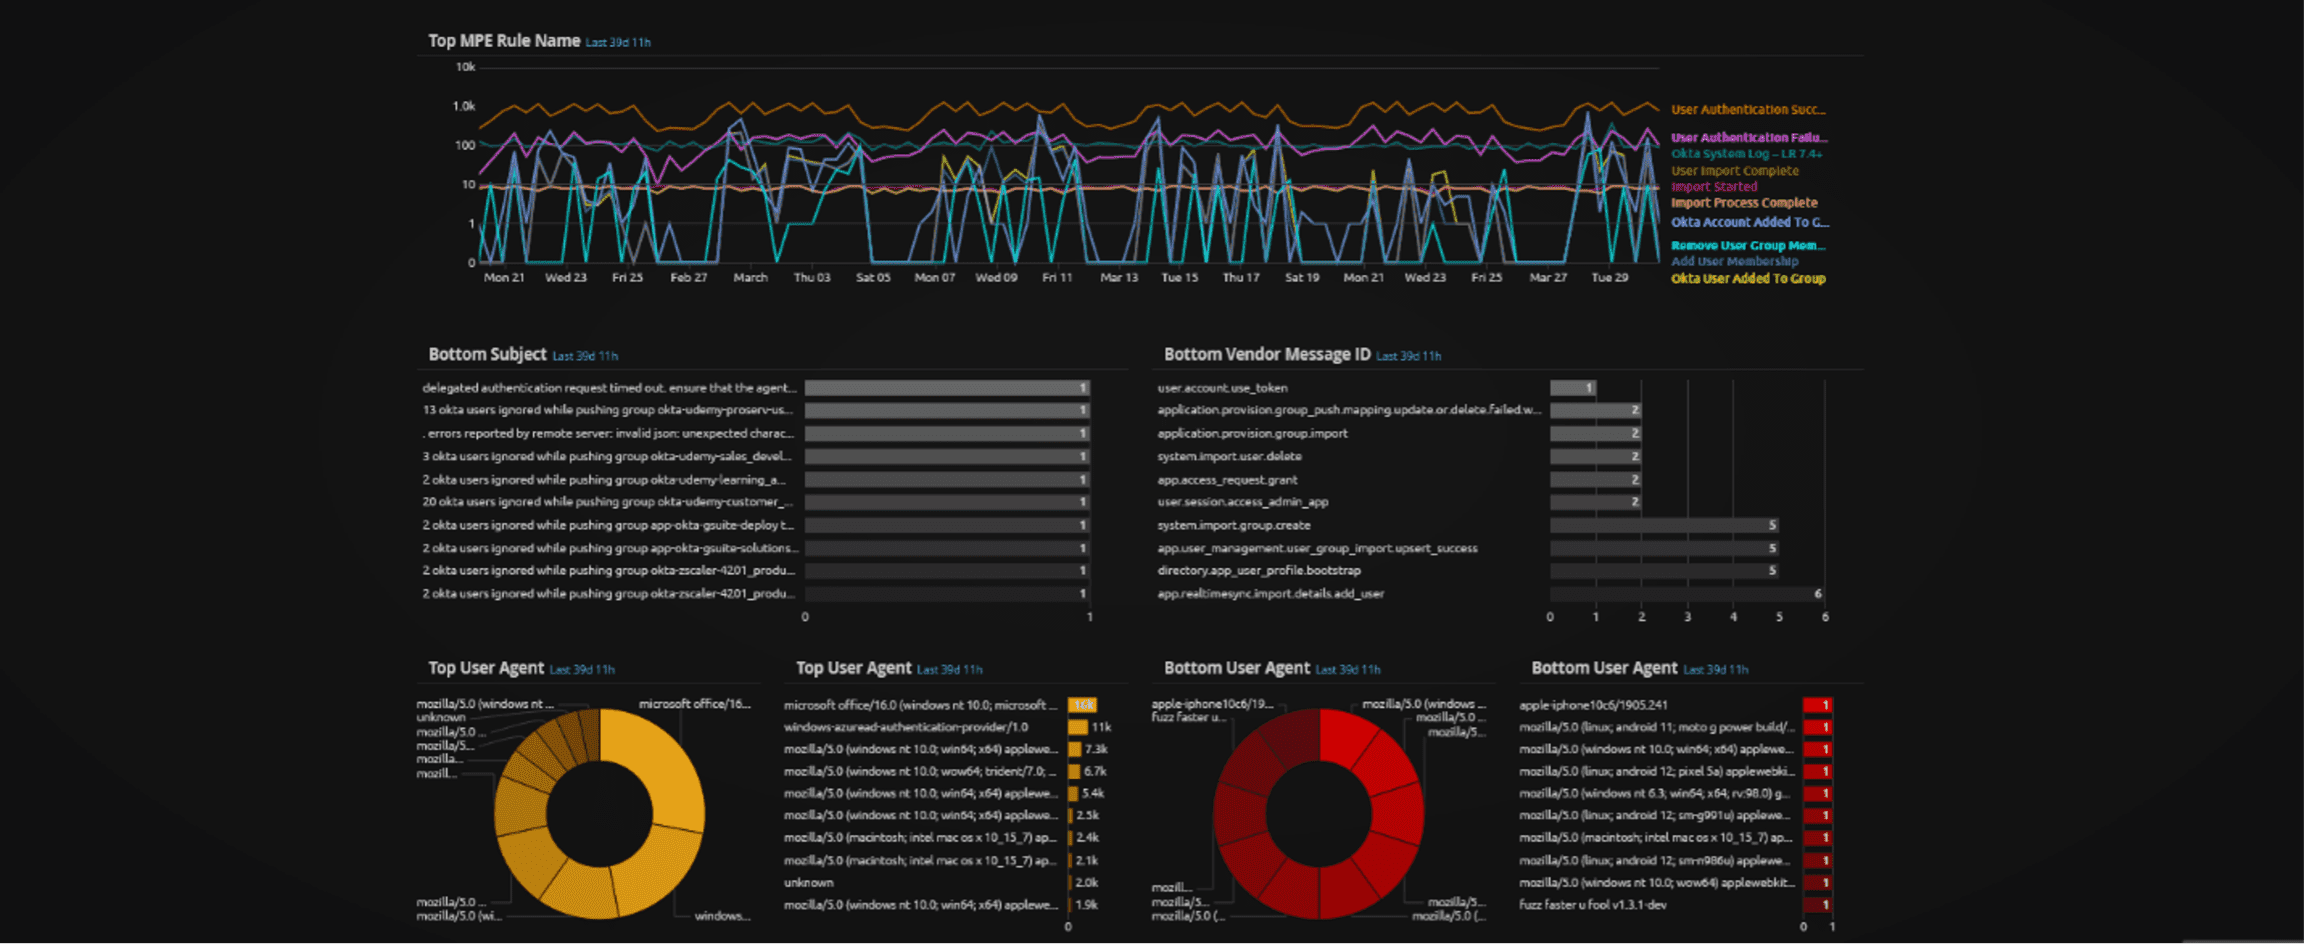
Figure 20: Custom Okta Analyze Web UI dashboard. Middle section of the dashboard.
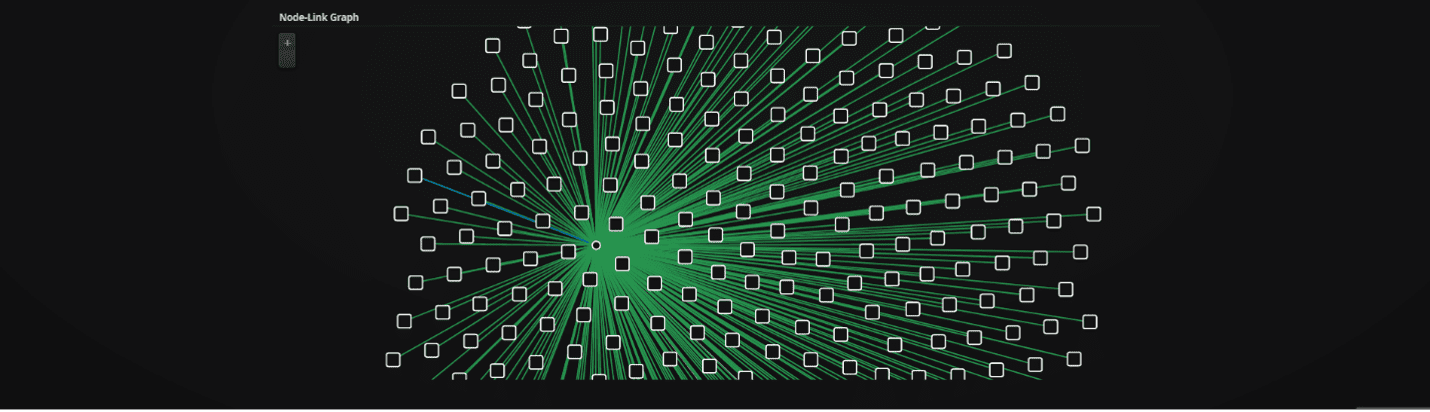
Figure 21: Custom Okta Analyze Web UI dashboard. Bottom section of the dashboard.
You can access the case and playbook without navigating away from the search results. Click on the “Current Case” side menu to reveal the case being worked on and the playbook.
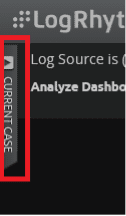
Figure 22: “Current Case.”
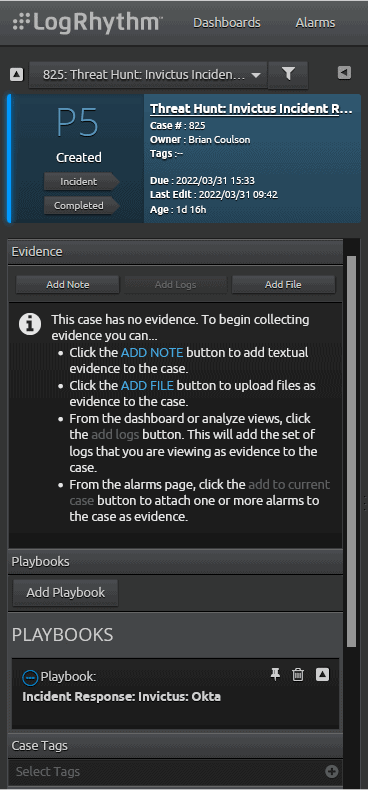
Figure 23: Current Case expanded.
Note: If the case you are currently working is not the one shown, you may use the case drop down at the top to find the case that you are working.
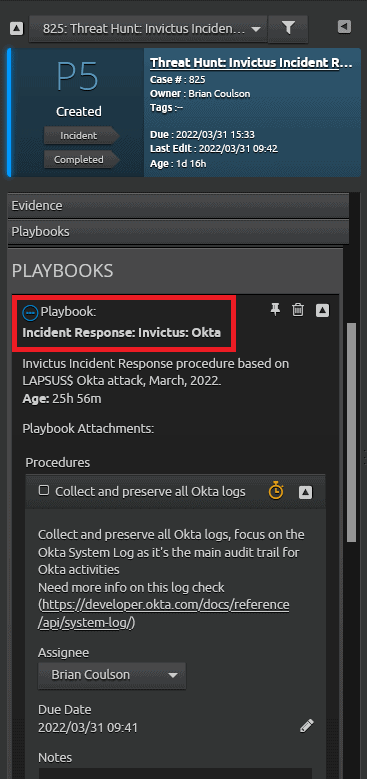
Figure 24: Click on the playbook name to reveal the procedures.
Per the procedure, now add all logs returned in the search in order to preserve them. Open the analyzer grid, select all logs, and add them to the case.
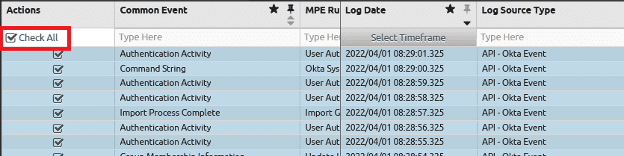
Figure 25: Check all logs to be added to the case.
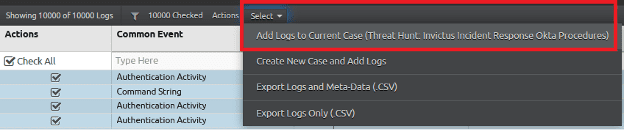
Figure 26: Select action to add logs to the current case.
You can now mark the procedure as complete by placing a check in the procedure box. Optionally, but recommended, explain what has been done in the Notes section.
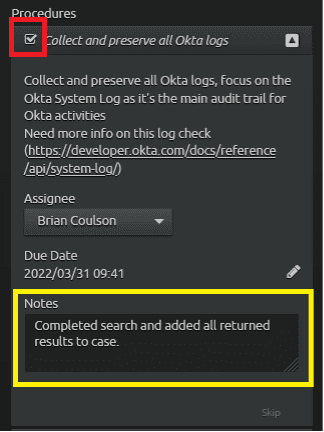
Figure 27: Mark the procedure as complete and add notes.
Procedure two: search your audit log for suspicious activity
Click on the next procedure named “Search Your Audit Log for Suspicious Activity.” Like before, assign the procedure and adjust the due date if needed.
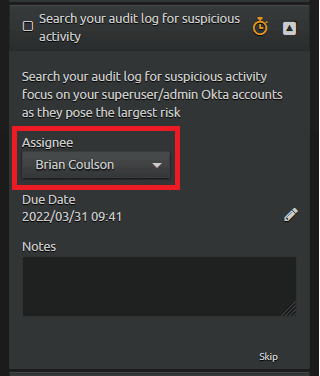
Figure 28: Assign the procedure (usually to yourself).
Use the custom “Okta: Analyze” dashboard and review the activity made by [email protected].
Tips for finding suspicious Okta activity
Note: Microsoft’s hunting queries and Open Source SIEM rules from Sigma are great to use in your threat hunt. I will walk through one of many methods to look for suspicious activity using the LogRhythm SIEM. I’ll also demonstrate an automated method to detect suspicious activity using LogRhythm’s AI Engine later in this blog.
- Start with “Bottom Common Event.” The least common event may reveal activity that is infrequently performed by an administrator and may reveal unauthorized changes made by staff without a change control approval, or an attacker modifying Okta to gain additional access and persistence.
- Example: Start with Access Revoked Activity by double clicking it, adding the criteria to the dashboard filter.

Figure 29: The filter is applied in the top left. Click the “x” to remove the filter. Click the log in the analyzer grip to display the parsed details of the log message.
-
- Remove the filter and go to the next least common event to investigate further. Continue performing those steps to determine if any suspicious activity has occurred. For any changes, or failed changes made, contact an Okta administrator to verify if they were attempting the change, or that it was part of a known change control activity.
- Review the “Bottom Region (Origin)” for authentication activity from unusual regions.
- Example: In the screenshot below, it’s unlikely there should be activity from Russia, Komi, Syktyvkar. You can now focus on that activity and note the parsed “Vendor Info” is “blacklisted request from IP: 178.68.179.119, location: Komi, Russia.” Add this IP address to a watch list and note this activity in the case.
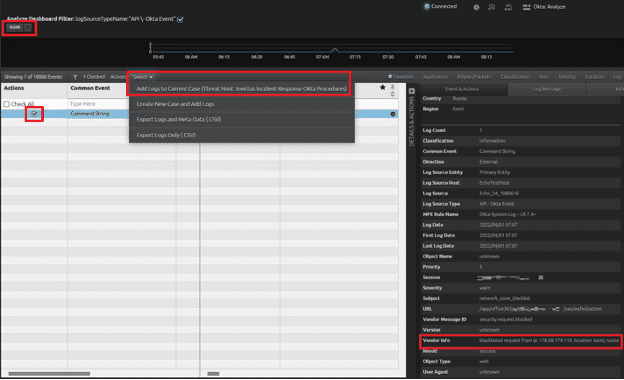
Figure 30: Filter on region “Komi,” view the log in the analyzer grid, and review the action taken by Okta. In this case, the IP address is in a deny list. Add the log to the case.
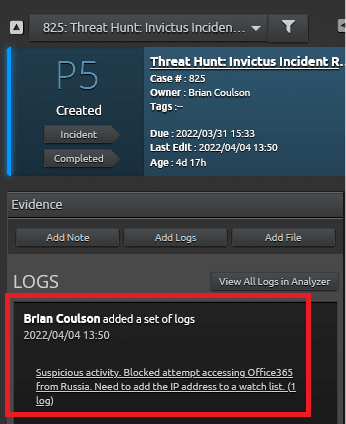
Figure 31: Newly added logs will be added to the case under the “Logs” section.
Continue through the logs, noting suspicious IPs and adding them to watch lists. If you come across anything that needs to be actioned right away, LogRhythm has developed an Okta SmartResponse that can be used.
Once the suspicious activity has been captured in case, mark the procedure complete and move to the next one.
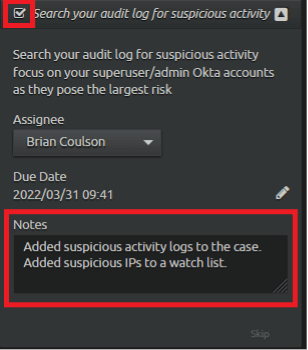
Figure 32: Add notes as needed. Place a check mark in the box to complete the procedure.
Procedure three: rotate passwords for high-privileged accounts
Start the procedure like in the other procedures by assigning the task, likely to themselves. The procedure states “Rotate passwords for high-privileged accounts, at this stage it might be a bit early to rotate passwords for all users.” The analyst, assuming they have sufficient permissions to do so, will reset the passwords for sensitive and administrative accounts. The logs produced by this action will be added to the case as evidence this procedure has been completed.
Tip: You can use the Lucene filter on the dashboard to filter for log messages in Vendor Message ID containing “reset.” This will help focus on all reset type of activity.
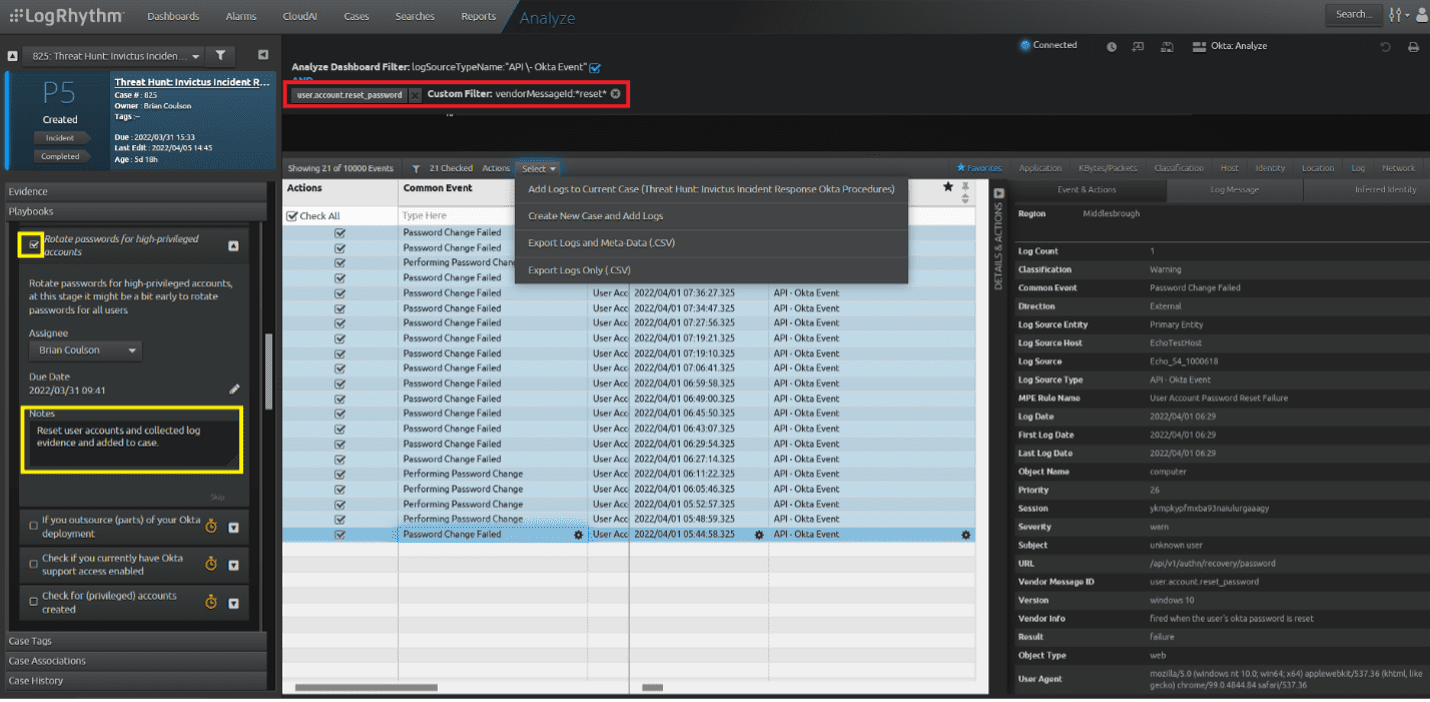
Figure 33: The red box shows the filters in place. Note the custom filter added through the Lucene filter. Once logs are added to the case, complete the procedure, and add a note that the reset is completed.
Procedure four: if you outsource (parts) of your Okta deployment
Expand the fourth procedure named, “If you outsource (parts) of your Okta deployment” to read more about the procedure. In this example, none of their Okta services are outsourced, so this procedure is not applicable. Instead of marking the procedure complete, click on “skip.”
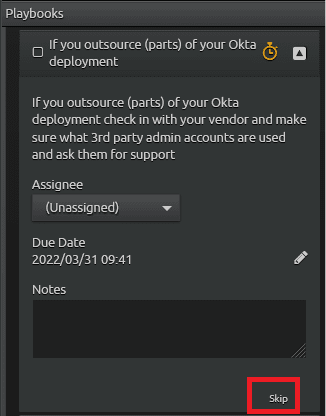
Figure 34: Click on “Skip” when a procedure is not applicable.
Procedure five: check if you currently have Okta support access enabled
Like before, evaluate the procedure, and if applicable, assign the procedure to yourself. The procedure states, “Check if you currently have Okta support access enabled, you might want to disable that for the time being more info.” You can click on the reference link to follow Okta’s procedure to give or remove support access. Once you verify that access is not enabled, you can note the procedure step and mark as completed.
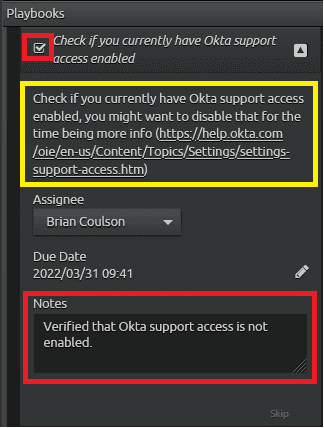
Figure 35: By embedding additional resources like a support article link in the yellow box, you can get further instructions if needed. Once the procedure is complete, check the box and note as appropriate.
Procedure six: check for (privileged) accounts created
In the last procedure, “Check for (privileged) accounts created.” You will likely assign yourself the procedure and read the description as to what they need to do. In this case, the procedure reads “Check for (privileged) accounts created around the time of the suspected breach – 21 January 2022.” The search result is already within the timeframe.
Filter on Vendor Message ID “system.import.user.create” and verify recent account creations. If any accounts are privileged accounts, they should be added to the case. Once you completed this task, mark the procedure as complete.
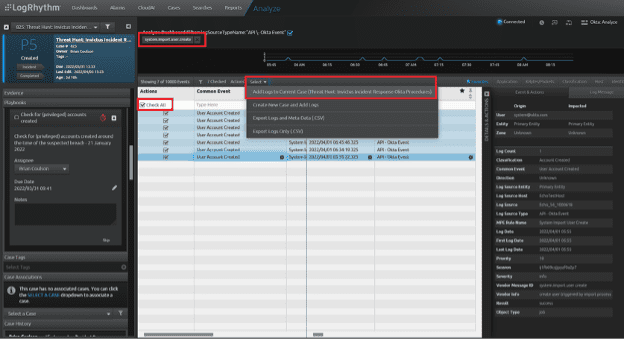
Figure 36: Filter the dashboard to display matching logs easily. Then select all the visible logs and add them to the case.
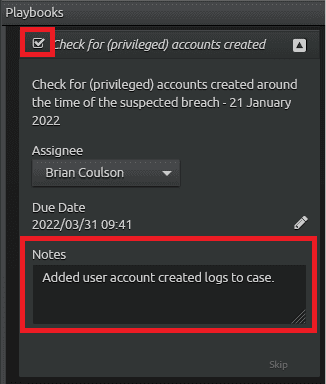
Figure 37: Once the logs have been added to the case, note the procedure appropriately and mark the procedure completed.
Completing the case
The analyst can now click the “Completed” button on the case. You can verify that all procedures have been completed or skipped as appropriate as shown in yellow. Then click on “Completed” as shown in the red box to complete the case and close it.
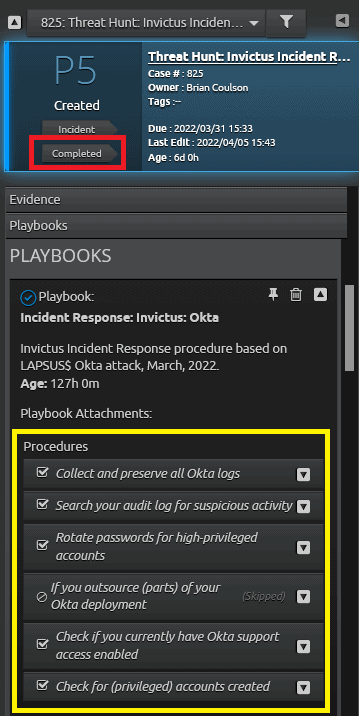
Figure 38: Verify that all procedures have been completed or skipped, then click “Completed.”
Case reporting and metrics
Now that the case is closed, there are metrics that are shown on the Case Dashboard. In the below image, the date to when the case was due is listed, as well as the time taken in the red box. The yellow boxes show bar charts and metrics of cases worked. From the legend, it’s easy to tell how many were and were not incidents, and what priority the case was.
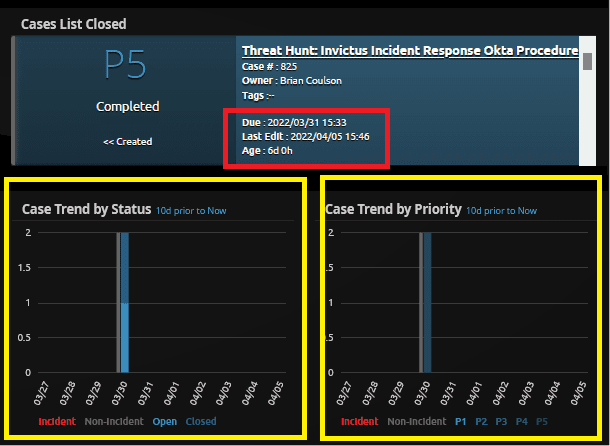
Figure 39: The red box shows the due date and time taken to complete the case. The yellow boxes show metrics around recent cases.
AIE events and rules
Microsoft recently published an article named “DEV-0537 criminal actor targeting organizations for data exfiltration and destruction” where they describe in detail the attacker group LAPSUS$, also known as “DEV-0537” by Microsoft. The Microsoft teams have also published detection guidance that can be leveraged within the SIEM. In LogRhythm, the detections are created in AI Engine. You can take guidance like this and easily add the detection logic into the LogRhythm platform.
In the following example, I will show how I will build a detection rule in AI Engine based on the Microsoft article to detect rare “Initiate impersonation session (Okta)” and “Rare MFA operations (Okta).”
AI Engine Trend rules
The following AI Engine rules are Behavioral Trend rules. LogRhythm recently released a blog named “Threat Hunting Anomalous DNS and LDAP Activity with Trend Rules” that covers trend rules, their purpose, performance considerations, and how to create them. For the purpose of this blog, I will focus on how to pivot third-party event information into a LogRhythm AI Engine Behavioral Trend rule.
Rare: Initiate impersonation session (Okta)
Microsoft’s “impersonationSession.yaml” rule use case is “User.session.impersonation are generally speaking rare events normally triggered when an Okta Support person requests admin access for troubleshooting. This query searches for impersonation events used in LAPSUS$ breach. Please review user.session.impersonation events and co-relate that with legitimate opened Okta support tickets to determine if these are anomalous.” There are several Okta events that Microsoft is considering for this rule. They are:
- session.impersonation.initiate
- session.impersonation.grant
- session.impersonation.extend
- session.impersonation.end
- session.impersonation.revoke
Creating an AI Engine rule that is similar to Microsoft’s rule is pretty straight forward. We can create a Log Observed rule that would event on each of these log events. As Microsoft notes, although these events should be rare, they could be more common than you think, and an analyst could easily get alert fatigue if the events were known activity. I’ll take Microsoft’s rule and change it to a LogRhythm trend rule. The goal with the trend rule is to event only once matching the same criteria over time. So, if this is normal activity, an analyst will only need to respond to it the first time, and over time, the normal event will no longer event, allowing an analyst to focus on other events that need their attention.
Note: AI Engine trend rules can be memory and processor intensive. Please refer to LogRhythm’s threat hunting blog to learn more.
The first step in creating the AI Engine Trend Rule is to define the Primary Criteria. Choose relevant log source types to be populated as in the example below.
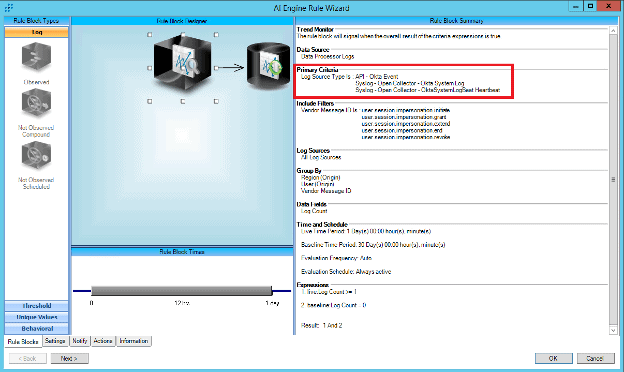
Figure 40: AI Engine Trend Rule. Configure Primary Criteria with known Okta Log Source Types.
Next, add the criteria from Microsoft security and their guidance on “Initiate impersonation session (Okta)” to the Vendor Message ID under the Include Filter.
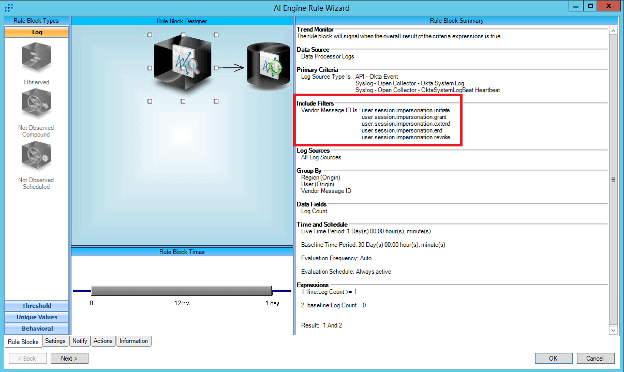
Figure 41: Add criteria based on Microsoft security guidance and “Initiate impersonation session (Okta).”
Next, add the Group By criteria that will be used to store baseline data.
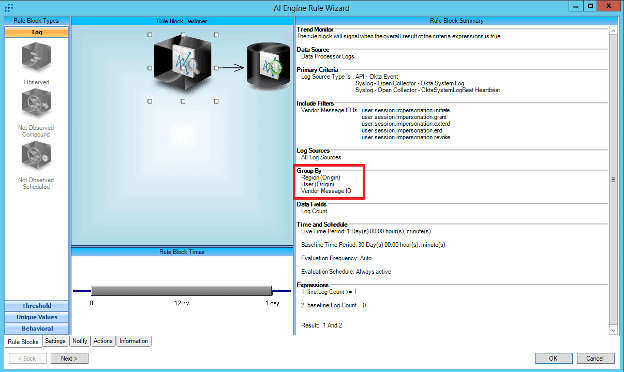
Figure 42: Add group by criteria of Region (Origin), User (Origin), and Vendor Message ID.
Next, set the Time and Schedule to evaluate the live data once a day (default is 1/3 of the live time period in which data will be evaluated, so in this example, once every eight hours) against the 30 days of baseline data.
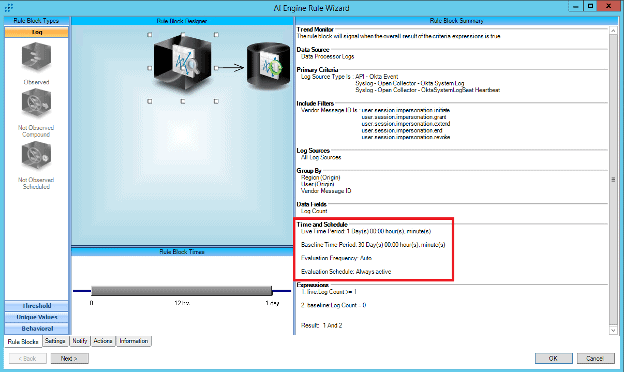
Figure 43: Set the Time and Schedule to evaluate the live period once a day and compare it against the 30 days of baseline data.
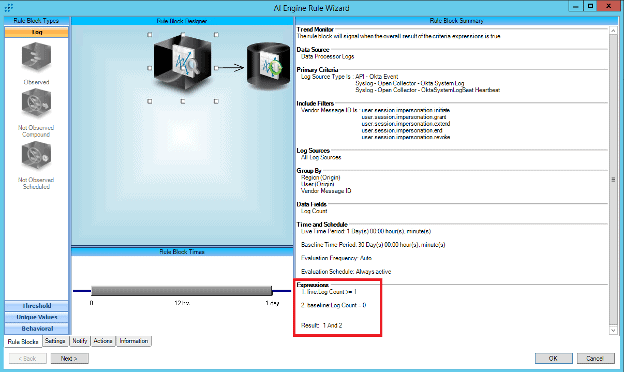
Figure 44: Set the expression to compare log counts where one or more live data is compared against zero records in the baseline. If true, then the rule will event.
Rare: Rare MFA operations (Okta)
The other Microsoft security “rare” rule is “Rare MFA operations (Okta).” The use case is “Multi-Factor Authentication (MFA) helps prevent credential compromise. This query searches for rare MFA operations like deactivating, updating, resetting and attempts to bypass MFA. Adversaries often attempt these operations to compromise networks and high-value accounts. Please verify that the behavior is known and filter out anything that is expected.” There are several Okta events that Microsoft is considering for this rule. They are:
- mfa.factor.update
- mfa.factor.deactivate
- mfa.attempt_bypass
- mfa.factor.reset_all
The AI Engine rule will be similar enough to the first rule that we will use a feature called “Clone,” where we can create a copy of the rule and modify it matching the new criteria.
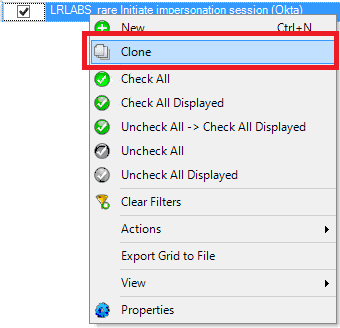
Figure 45: Select the AI Engine rule you want to clone, then right click to select “Clone” on the menu.
After cloning the rule, update the “Include” section by removing the current content and add the new criteria.
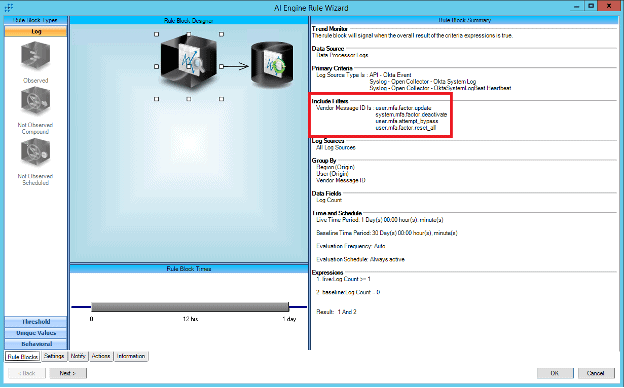
Figure 46: Include filter updated with new criteria.
Summary
In the first section, I showed you how you can threat hunt using third-party incident response guidance and measure your hunt using LogRhythm Case Management. In the second section, I showed you how you can use third-party detection logic and pivot that into LogRhythm AI Engine for continuous detection. Taking third-party guidance into LogRhythm is easy to do, and the benefits on doing so are measurable, and actionable.
You can download the content shown in this blog here:
The post The LAPSUS$ Supply Chain Attack: Third-Party Playbooks and Detections appeared first on LogRhythm.
*** This is a Security Bloggers Network syndicated blog from LogRhythm authored by Kelsey Gast. Read the original post at: https://logrhythm.com/blog/the-lapsus-supply-chain-attack-third-party-playbooks-and-detections/
