

Discovery, Mapping and Monitoring of VMware and Microsoft Hyper–V
The concept of virtualization originated in the late 1960s and early 1970s and this technology has been in wide use ever since. As noted in our blog “Containers vs. Virtual Machines (VM): All You Need to Know,” more than 90% of companies in Europe and North America use server virtualization.
While VMs boost IT scalability, agility and flexibility, monitoring and managing a virtualized environment requires IT management tools that support this technology.
Today’s small and medium-sized businesses (SMBs) rely on a hybrid environment that consists of a combination of on-premises and cloud-based infrastructure. According to the Spiceworks 2020 State of Virtualization Technology report, 77% of on-premises server workloads are virtualized. That’s why it’s important to be able to monitor and manage virtual hosts and VMs across your IT environment.
VMWare and Microsoft Hyper-V
VMWare and Microsoft Hyper-V are two leading server virtualization vendors. Hyper-V is a type-1, native hypervisor provided by Microsoft. It allows you to run multiple operating systems (OS) and VMs on a single physical server.
Similarly, VMware is a virtualization technology that allows you to run multiple OSes and VMs on the same physical machines.
Discovery and Mapping of Virtual Environments
While many Remote Monitoring and Management (RMM) tools have limited functionality, Kaseya VSA, a unified RMM solution, discovers and includes VMware and Hyper-V hosts and VMs on its network topology map. With Kaseya VSA, you can also see the host and guest VM relationships on the network topology map and get detailed VM information via the QuickView feature in VSA.
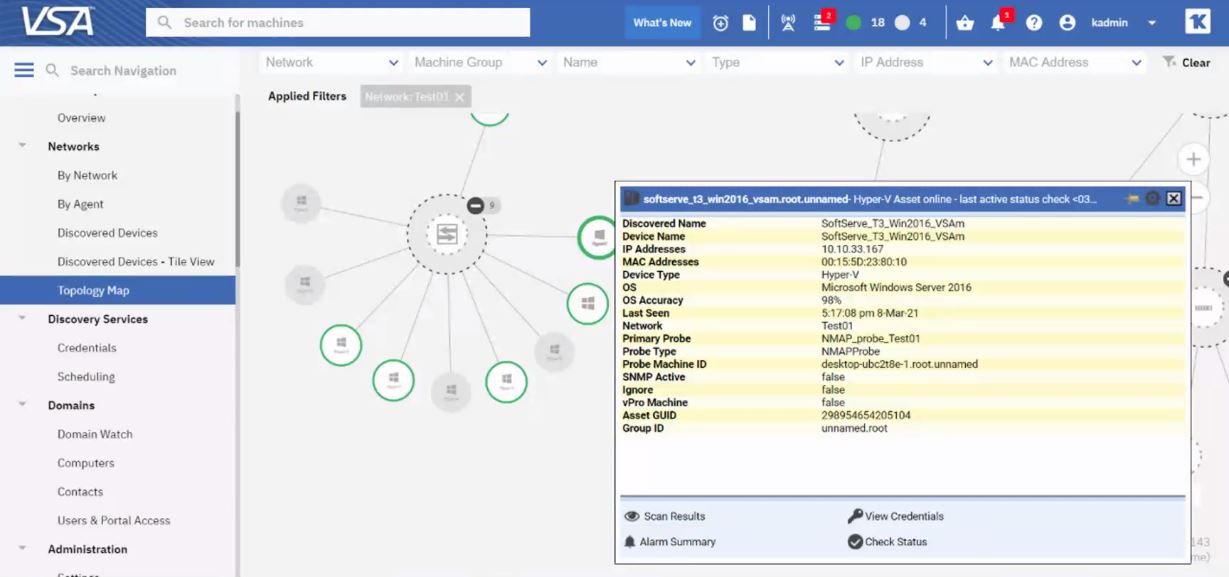
Kaseya VSA Network Topology Map showing the QuickView window for a Hyper-V VM
Virtual Environment Monitoring
Your RMM tool should not only leverage Simple Network Management Protocol (SNMP) but also application programming interface (API) and Windows Management Instrumentation (WMI) monitoring capabilities. WMI is specifically used for monitoring Microsoft Hyper-V environments.
A unified RMM tool monitors virtual hosts for the following:
-
Operational Status
-
Uptime
-
System Health
-
Alarm Status
-
Software Version
-
CPU Core Status
-
Number of vCPUs
-
vCPU Utilization
-
Physical Memory Utilization
-
Virtual Memory Utlization
-
Disk Status
- Network Traffic Volume
- etc.
It should also monitor Guests (VMs) for the following:
-
Operational Status
-
Uptime
-
CPU Utilization
-
CPU Ready Time
-
Memory Utilization
-
Memory Balloon
-
Network In/Out
-
Disk Space Utilization
- Available Disk Space
- etc.
Your RMM tool’s monitoring capabilities should include the ability to perform various actions, like the ones mentioned below, when an alert occurs:
-
Generate an alarm in the RMM tool UI (shows an alarm icon on a node in the topology map)
-
Create a service ticket
-
Execute a script (agent procedure)
-
Send an email notification
Managing “everything” in today’s complex IT environments means you need the capability to discover, map and monitor your virtual environments. Knowing what is in your virtual environment and how it functions is key to quickly identifying and resolving IT incidents.
Learn more by downloading the checklist: 11 THINGS TO MONITOR AND MANAGE WITH YOUR UNIFIED REMOTE MONITORING AND MANAGEMENT SOLUTION
You can also request a demo of Kaseya VSA.
![]()
![]()
The post Discovery, Mapping and Monitoring of VMware and Microsoft Hyper–V appeared first on Kaseya.
*** This is a Security Bloggers Network syndicated blog from Blog – Kaseya authored by John Emmitt. Read the original post at: https://www.kaseya.com/blog/2021/06/15/discovery-mapping-and-monitoring-of-vmware-and-microsoft-hyper-v/
