

Querying detailed whole-program representations with 100+mil LOC on commodity hardware
When designing feature-rich whole-program graph representations, a core conflict exists between the desire to model as many aspects of the program as possible and that of keeping the graph small enough for timely processing on commodity hardware. This article outlines techniques that help deal with this dilemma, making it possible to query graphs with hundreds of millions of nodes interactively.
Security-critical codebases such as those of Chromium, Firefox and major operating system kernels contain hundreds of millions of lines of code. Serious attempts to secure codebases of this magnitude and complexity require at least partial automation. Where possible, fuzzers are employed today to point out invalid memory accesses and faulty behavior that may warrant further inspection. Where we severely lack as an industry is in our capabilities to automatically reason about code in ways in which a skilled analyst would, both to seed analysis as a fuzzer would, but also for investigation that goes beyond the crash.
As for any system that reasons about data, a prerequisite is to supply it with the necessary sensors so that it can make sense of the world around it. In this post, I would like to make you aware of some work we have done at ShiftLeft in recent years on querying of large program representations. On the one hand, I’d like to point out to professional vulnerability researchers that the open-source code analysis platform Joern and its commercial big brother Ocular can now be used to conveniently query many of the large codebases that exploit acquisition platforms deem security relevant enough to pay top dollar. On the other hand, I hope that those parts of our core technology that we have made available as open source can provide a stepping stone for researchers interested in advancing the state of automatic program analysis, in particular as far as learning-based systems for vulnerability discovery are concerned.


Large multi-faceted program representations
Some researchers will try to convince you that tokenizing code and throwing it into a deep learning algorithm will magically yield vulnerabilities, and you as a security professional are rightfully raising your eyebrows. What they are suggesting to you is the equivalent of showing black and white photos of fruit to a person and asking them about the fruit’s color. Eventually, the person will memorize that most oranges are orange — but paint them green and they will not notice the difference. This, however, is not a limitation of machine learning but one of the representation. Let me illustrate this point in more detail.
Imagine two functions in a program that are exactly the same, except for the order of their statements. Now, let’s say we tokenize these functions and for each of them, determine the set of tokens they contain. The two sets will be the same. Now task a machine learning system — based on this data — to keep apart the two functions and it has no way of succeeding. That is the core problem.
What this means is that you will need to encode statement order in some way, and this is the tip of the ice berg, because few vulnerabilities will only depend on the presence of certain statements and their order. You will want to encode much more of this low-level information, such as data flows, dominance relations and call chains, but also much higher information such as reachability via HTTP endpoints or configurations and annotations. In short, you want to accumulate as many perspectives on a program as possible and correlate them.
Directed edge-labeled graphs shine in this setting as they allow many different relations between code elements to be encoded in the same data structure. Think of each node as some part of the code, e.g., a function, a literal or a parameter. You can draw edges to express relations between these parts, e.g., you can draw a call edge between from a caller to a callee or a type hierarchy edge between a type and its base type. You can think of edges as relationships between nodes — and as summaries of previously calculated results. Code Property Graphs implement this idea and provide a multi-faceted whole-program representation for code mining and feature extraction.
How large are these representations really?
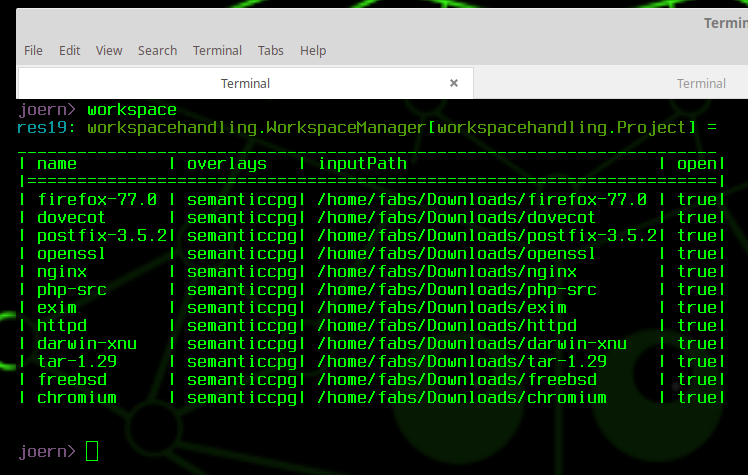
To illustrate the size of the graphs we are dealing with today, I have imported the codebases of 12 projects, all of which are listed by exploit acquisition programs as relevant. This includes the two browsers Firefox and Chromium, the OS kernels XNU and FreeBSD, the webserver nginx and Apache httpd, the programming language PHP and the mail servers Postfix and Dovecot.
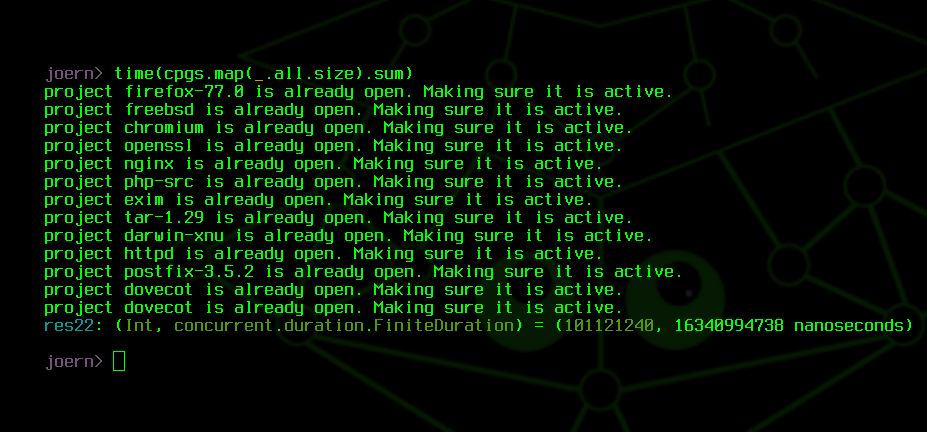
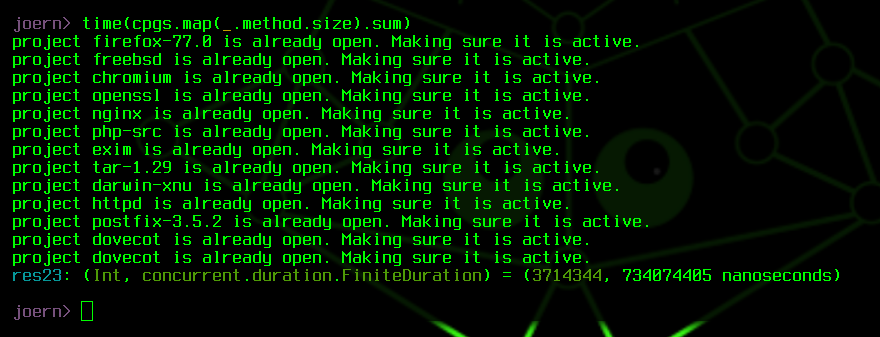
Code Property Graphs are multi-layered, and in this case, I have only generated the base layers for each graph. This includes source files, program functions, types, syntax trees, control flow graphs, call graphs and type hierarchies. Querying these graphs and iterating over all nodes yields a total of 101 million nodes, returned in 16 seconds. Nodes are indexed by type, and so, we can swiftly obtain the number of functions as well: approximately 3.7 million functions, returned in 0.7 seconds.
Handling these large graphs
In short, these graphs are quite big, and even if we try to store them efficiently, they will become bigger over time as we add more and more perspectives and computation results. Therefore, it is beneficial to come to terms with the idea that the graph will generally not fit into main memory and that, even if it does, loading it entirely into memory comes at a high performance cost. Also, consider the setting where we run multiple analysis stages on different cloud nodes and each of them individually answers only very basic questions about the graph — a setting that is vital to support for code analysis in the cloud. In this setting, it becomes particularly clear how wasteful it is to load the entire graph.
Lazy loading and Overflow
Consider in contrast the situation where we do need to touch most of the graph and that graph fits into memory just fine. In this case, we would like to keep performance penalties low. In short, we would like a lazily loaded graph that does not eagerly return nodes to disk but is able to deal with the situation where the graph is too large to fit into memory in its entirety.
We — and in particular Michael Pollmeier and Denis Yermakov — have dealt with this problem by creating OverflowDB. OverflowDB fully loads graph elements only as it becomes necessary. Moreover, it monitors heap usage and only unloads and serializes graph elements to disk if we otherwise run out of heap memory — an overflow-to-disk mechanism, if you will. For more details on the topic, you can take a look at the README.
Passes and Streaming DiffGraphs
A second observation we made over time is that is is key to decompose queries whenever possibly — and that this is indeed possible in many cases. Let’s say for example that you want to find all functions that have a nesting-level greater than two: it is not necessary to keep the entire graph in memory at once to answer this query, checking functions one by one is perfectly sufficient. However, considering that even mobile phones have multiple cores at this point, they key question becomes how you distribute this work among multiple worker threads or even multiple machines without creating complex races. Streaming diff graphs are the core ingredient we have realized to deal with this setting.
The idea is to structure analysis into so called passes — named due to their close correspondence to the passes of a compiler. The pass logically partitions the graph into sub graphs that can be processed independently and spawns workers to perform calculations on sub graphs in parallel. Workers may only read the graph, making it unnecessary to perform complex locking on graph fragments to limit write access. Instead, workers reports the changes they would like to make to the graph as so called DiffGraphs- named so because they work just like patches produced by the Unix diff tool. If possible, these diffs are applied to the graph in a stream, removing the necessity to store them in main memory over a longer period of time, however, the pass controls this behavior, e.g., allowing it to prevent sub graphs of the graph from changing that workers may still need to access prior to modification.
Conclusion
Moving the needle for automated vulnerability discovery with static analysis and in particular via data-driven approaches requires feature-rich and unfortunately large program representations. Making these representations available to interactive querying for integration into the analyst’s workflow is a challenge in its own right. The post discussed some of the core ingredients of our approach to tackling this challenge and I invite you to try out joern and study its codebase.
Querying detailed whole-program representations with 100+mil LOC on commodity hardware was originally published in ShiftLeft Blog on Medium, where people are continuing the conversation by highlighting and responding to this story.
*** This is a Security Bloggers Network syndicated blog from ShiftLeft Blog - Medium authored by Fabian Yamaguchi. Read the original post at: https://blog.shiftleft.io/querying-detailed-whole-program-representations-with-100-mil-loc-on-commodity-hardware-ffbf2d50ee70?source=rss----86a4f941c7da---4
