

Building Tier 1 IP Transit – What’s Involved and Why Do It?
Not all internet connectivity is created equal. Many Tier 2 and Tier 3 ISPs, cloud service providers and data integrators consume IP Transit sourced from Tier 1 Wholesale ISPs (those ISP’s that build and operate their own fabric from L1 services up). In doing so, their ability to offer their customers internet services customised to particular requirements is limited by the choices they have available to them – and many aspects of the services they consume may not be optimal.
1. Why Build Tier 1 IP Transit?
A. Quality
No vendor of IP Transit is directly upstream of all sources of content or demand for content. At some point in the internet fabric the Tier 1 provider relies on the quality of the upstream services they acquire through such mechanisms as peering, CDN connectivity or third-party IP Transit providers. The temptation for some Tier 1s may be to acquire the cheapest sources of transit rather than the best routes (least hops and least contention). In addition to this, some end users of internet services require customisation. For example, an international company might require one or more low latency routes to various locations. If their service provider is buying an IP Transit service from a Tier 1 provider, the ability to meet custom requirements may well be very limited.
In addition to the quality of connectivity, it is also important to know how resilient the points of connectivity are. Any single point of failure with an IP Transit fabric is undesirable. We consider that N+1 is a minimum and N+2 is significantly preferable. This tenet should extend to the physical design too. At the Layer 1 level, are links to international cables diverse? Are there any common ducts in use? Some vendors of IP Transit are reluctant to reveal the exact details of underlying design.
If any of the above issues are causing problems for consumers of IP Transit, there is a reason to consider building a Tier 1 capability.
B. Security – DDoS Protection, Data Scrubbing, WAF and Reporting
If you are a major consumer of IP Transit and you can’t buy Secure Transit to meet your needs – you might consider building it yourself. Traditionally, Wholesale Tier 1 Internet Service Providers have focused on Distributed Denial-of-Service (DDoS) protection in terms of protecting against volumetric attacks. That is, attacks that send large volumes of traffic towards target IP addresses, often from distributed sources. The objective is to flood the various sources of ingress/egress to an ISP fabric, such that desirable traffic cannot reach its destination due to contention occurring between source of content and the recipient. Volumetric attacks operate at Layer 3 but can impact both L3 and L2 parts of the ISP infrastructure.
The reasons for the historical focus by ISPs on volumetric attacks is probably because the decision-makers involved have largely been interested in protecting their own infrastructure rather than the intended attack recipients’. Evidence of this is the fact that the traditional remediation of an attack has been the ‘black-holing’ of the recipient IP addresses, so that the target of the volumetric attack is no longer advertised by the ISP. The attack in this way has been made successful.
[You might also like: Accessing Your Crypto Wallet Through Android Devices?]
Black-holing would commonly follow traceroute analysis by the ISP’s engineers to ascertain the recipient attracting the attack – a process that may take anywhere from minutes to hours.
The advantages of the approach (from an IP Transit provider’s perspective) have been perceived as follows:
- The detection of the attack and manual analysis thereof is (relatively) low-cost for the ISP, at least case-by-case it seems so.
- The manual process of analysis and black-holing has been defended by ISPs as preferable to the auto-detection/mitigation on the (outdated) basis that the risk of a ‘false positive’ detection/mitigation is high. This is no longer necessarily true.
- The attack recipient loses connectivity but is seen as collateral damage, with the balance of customers (eventually) having services restored.
Those companies that desire to offer attack mitigation at the source of the attack, rather than downstream black-holing of their customer may become frustrated by the lack of more sophisticated Wholesale IP Transit security services available to meet growing customer demand. This is another reason to evaluate building your own Tier 1 IP Transit infrastructure.
C. Cost of Manufacture
In a relentlessly competitive market (say, Telecommunications), driving the cost of manufacture of service components down is business as usual. In many board rooms, cost-saving opportunities will garner more sincere attention and appetite for investment than other drivers. In the long term a Tier 1 provider has the opportunity to optimise their cost to manufacture IP Transit through the following means:
- Volume of buying on L1 (optical) international services (and/or the use of their own international cables). Typically, the cost of L1 international services is proportional to the volume of these services. L1 services will often make up a significant component of the cost to build IP Transit. Such costs (on a per-megabit, per-second basis) tend to fall over time while data volumes grow with time.
- Operating your own Tier 1 IP Transit fabric lends itself to offering Wholesale IP Transit to lower -tier consumers of transit, and in so doing to aggregate demand and drive buying volume up – therefore your own price point down – for the elements involved.
- The aging of contracts helps in building margin. For example, during a three-year contract on IP Transit you will tend to see the input prices dropping (on a rolling average basis) while the customer contract might be fixed price.
- Value-added services, such as data scrubbing, L3 to L7 DDoS detection and event reporting are an opportunity for accretive margin contribution.
In each of the above cases it is arguable that the Tier 1 IP Transit provider operates with a positive margin contributed to by its wholesale customers (over the long term). This bottom line margin opportunity might be attractive to the buyer of IP Transit, if the business case stacks up. The ability to increase top line by entering a new market or improving services to meet market demand seen in a direct customer base (enterprise, government or residential customers) is also a possible driver.
The economics of each market are different and undertaking a project to build your own infrastructure is not for the faint-hearted. However, if you already buy significant volumes of IP Transit or you have other drivers it may be worth evaluation.
Following is a case study taken from our own experience in building Secure IP Transit services for consumption in Australia, New Zealand and the U.S. We hope it serves as an example of the considerations involved.
2. Case Study
FeeniX Communications’ Secure IP Transit
While each market will present a different set of challenges, the principles remain similar when considering optimising a design for IP Transit infrastructure and connectivity within any given market.
A. The Plumbing
New Zealand is an island nation. To our east sits the U.S. To our west, Australia. New Zealand is a net consumer of internationally-generated content. In fact, there has only been one moment in history during which the world consumed more content from New Zealand than New Zealand consumed from the world. As the most eastern principality with respect to the international date line, many eyes turned this way to see what happened as 1999 rolled into 2000. Nothing much, as it turned out. The reason for raising this point is that traffic patterns are the first consideration in designing an IP Transit fabric. In the case of New Zealand, the aggregated traffic patterns are approximately as follows (at the time of writing):
- 10% of content (by volume) is generated in New Zealand and mostly accessible through peering, with some requirement for IP Transit to customers of the two largest carriers
- 35% of content is consumed via local CDN’s (e.g. Netflix, Akamai, Google)
- 35% of content is consumed via Australia, which includes peering and IP Transit to certain routes in Asia, Europe, etc.
- 20% of content is consumed via the U.S. available via several upstream IP Transit providers, providing access to U.S. content, Europe, Africa, Asia, etc.
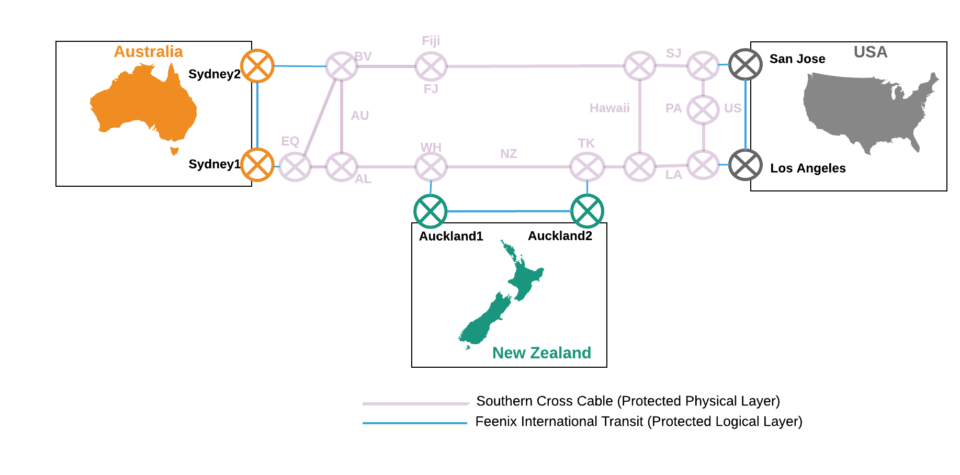
So, it is pretty obvious that we needed to connect New Zealand to Australia and the U.S. via L1 services. Following our own design mandate of N+1 or better, we selected international services with:
- Two landing stations in New Zealand (both in Auckland but geographically separated)
- Two landing stations in the U.S. (San Jose and Los Angeles)
- Two landing stations in Australia (both in Sydney but geographically separated)
Once again, the design mandate of N+1 indicated that we required protected international routes to cope with the possibility of equipment failure or a fibre cut to any single route.
The architecture we initially deployed is described by Figure 1. Note that the network is isotropic in that it has the same properties when viewed from NZ, Australia or the U.S. This is an important design consideration when a Transit provider is interested in offering services in each country where it is has routing/peering/transit capability.
B. Layer 3 (L3) Connectivity (Peering and Upstream IP Transit)
The objective of L3 connectivity is to ensure that each source of content and consumer of content is accessible to users of the providers’ IP Transit services via optimal routes (lowest latency and least contention) – with redundancy such that in the event that an upstream transit or peering session is lost, alternative sessions are available. Routing tables are generally set to select the shortest/lowest hop count route to content and to the consumer of content but will route around the loss of a session.
It is common for ISPs to peer within a particular country, whereby each sends and receives traffic from ‘peers’ without charge – apart from the costs to access the peering. There are many exceptions to this principal though, often in cases where ISPs with dominant market share charge other ISPs for access to consumers and providers of content connected to their networks. The mix of peering and upstream IP Transit therefore tends to be unique to the location.
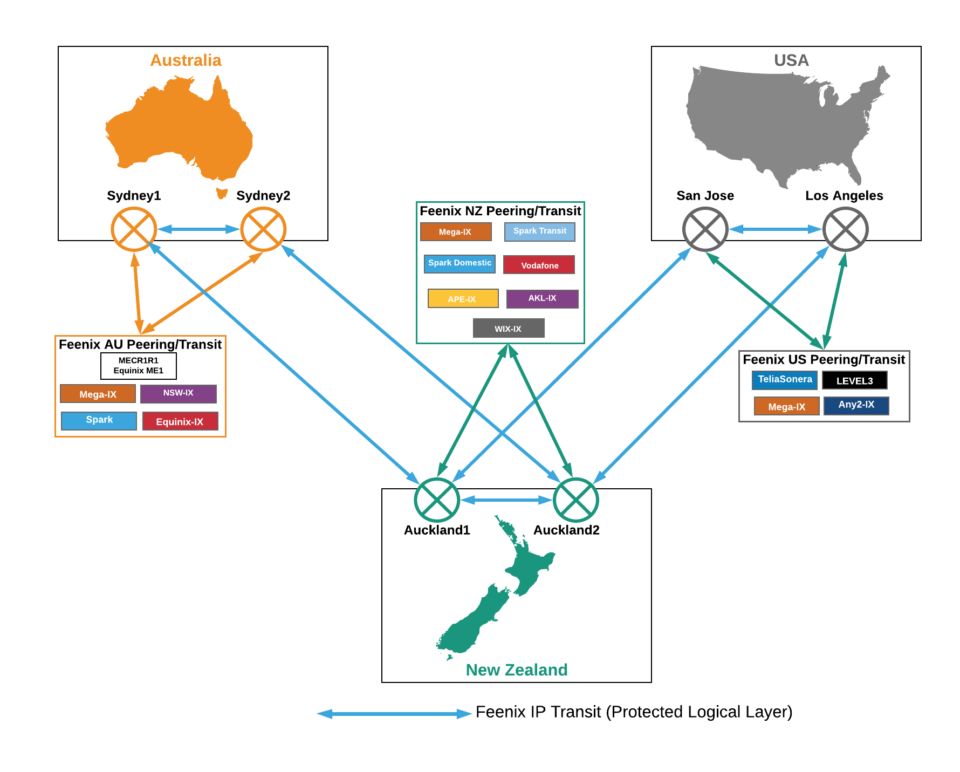
Feenix’s IP L3 connectivity by country provides an example of this – although please note that changes are regularly made to add or replace peering and or transit providers to optimise performance on an ongoing basis.
In the U.S. we selected Level 3 and Telia Sonera as the upstream IP Transit providers. The selection criteria was based on performance ahead of price. In the Bakers Dozen report, ranking IP Transit providers, both of the above providers arewell ahead of the pack. As mentioned earlier, all internet is not created equal. In addition to IP Transit we connect services to a number of peers, such as Mega-IX and Any2-IX.
[You might also like: Personal Security Hygiene]
The total of upstream IP Transit and peering connectivity is approximately Nx2, where N is the contracted capacity of transit potentially consumable by customers. This enables re-routing of traffic in the event that any peer or upstream suffers performance of services.
In this case another diagram will provide a better picture of what is a snapshot in time of peering and IP Transit providers contributing to our internet services.
 C. Network Infrastructure
The vendors of network equipment tend to have strengths, weakness, price points and functionality that varies according to use cases. Some questions to ask before selecting network infrastructure are:
- The number of routes to be handled by routing tables. Pay careful attention to memory constraints and the meaning of specifications issued by the vendors.
- How much capacity will conceivably be carried within the investment period under consideration.
- What level of functionality is required from your internet routers. Some product sets are very strong on BNG functionality while others may offer better price points in terms of routing table capacity and port density, for example. Note that the best internet router may not (and won’t be) the most efficient transport device, for handing over services to customers or for connecting broadband handovers to.
- The question of where to locate network infrastructure is crucial. It is commercially desirable to locate infrastructure physically within aggregation points for ISPs, international cable operators, transit providers and other participants in the ecosystem, for the simple reason that it reduces the cost to connect between them. There are generally choices available. Determine which of these is best in terms of connectivity, power quality, protection systems and footprint/power price points.
FeeniX selected Nokia (formerly Alcatel Lucent) 7750 BNGs and a range of other Nokia devices for Provider Edge and Transport. The 7750 BNG functionality is high, reliability solid and we rate their Level 3 support capabilities highly. We have also built full infrastructures on Juniper platforms. Also excellent. Obviously, there are other choices.
D. Security – Cyber Attack Detection and Mitigation
When Feenix embarked on the design stage, we had it front of mind that we would build in leading-edge security capabilities and offer them as part of the IP Transit services. We had the following thoughts:
- We wanted to be able to detect and mitigate attacks at source rather than black-holing the attack target downstream – the common but crude approach to DDoS attacks by many Transit providers and which our design team (and others involved) had all been part of in previous companies.
- We wanted to be able to auto-detect and auto-mitigate – without statistically significant risk of false positives (mitigating against legitimate data, such as spikes in volume which could be attributable to, say, a podcast). Automation is a fundamental tenet in all of our activities.
- We wanted to incorporate leading zero day capability into our solution. We saw zero day attacks as the most problematic threat to address, and this was the major reason we decided we would not build our DDoS solution based upon open source tools and custom code.
- We recognised the need to protect against the proliferation of attacks targeted at Layers 3 to 7 which are commonly and easily enabled by cyber criminals. This occurs through the acquisition of attacks via the Darknet and enabled by various IoT Bots, application stressors and other nefarious mechanisms.
- We wanted to detect and mitigate attacks at the sources of ingress to our IP Transit services to minimise their impact and protect our (relatively) expensive international bandwidth.
- We recognised the need to achieve the above objectives while still being able to provide cost-effective services and generate acceptable margins, which creates a considerable challenge.
[You might also like: Battling Cyber Risks with Intelligent Automation]
After evaluation of the options available to us, we selected Radware as the provider of our security appliances and applications.
- Zero Day attacks are managed through a series of mechanisms including a 24×7 Emergency Response Team is in place to respond to zero day attacks. Perhaps even more importantly, they endeavour to anticipate attacks using AI to detect anomalies in traffic patterns. Also, security specialists monitor the Darknet for indications of upcoming attacks; prepare strategies to detect and mitigate against known but not yet exploited vulnerabilities; collate and interpret data gathered by an extensive Deception Network deployed internationally (sometimes known as honeypots).
- Auto detection and mitigation can be applied with a very low risk of ‘false positives’, due to analysis of multiple attack vectors simultaneously (comparing known positive and known negative vectors) before acting upon any given attack. Auto detection and mitigation are crucial elements to efficiency in terms of engineering resources.
- With the range of DoS attacks prevalent today we determined that detection of Layer 4,5,6 and 7 vectors was crucial to our solution.
- We liked the data scrubbing capability offer within Radware’s DDoS appliances rather than having to direct traffic away from our core network towards cloud scrubbing centres.
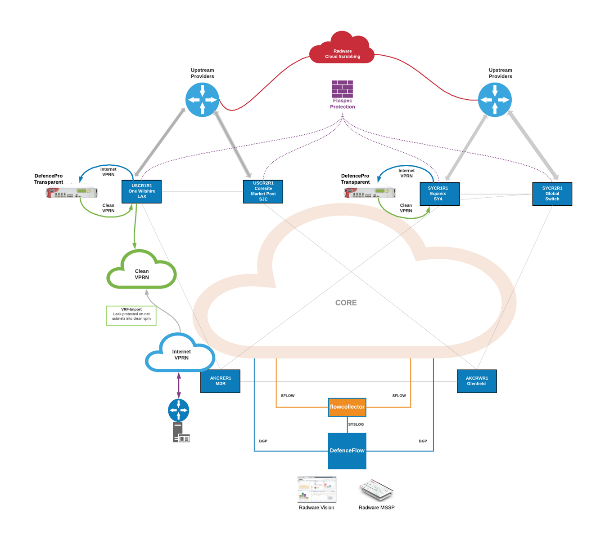
Figure 4 shows the full fabric of the Feenix Secure IP Transit infrastructure, from L1 through to L3 and security.
About Feenix Communications:
FeeniX Communications is provider of telecommunications services, founded by a group of industry veterans and 30% owned by Spark New Zealand (formerly Telecom New Zealand).
Read the “2018 C-Suite Perspectives: Trends in the Cyberattack Landscape, Security Threats and Business Impacts” to learn more.
Richard Cohen
Richard Cohen is Co Founder and Executive Director of FeeniX Communications. He began his career in the Power industry designing and building resilient communications systems and has been working in theTelecommunications Industry for decades. “I love Telecommunications. There are always new technologies emerging and commercial challenges to be solved. For example, at this moment in time the emergence of Artificial Intelligence involved in the perpetration of cyber crime is both appalling and fascinating. I have been enjoying the unique insights to this field that Radware share with us, like an old dog learning new tricks.”
*** This is a Security Bloggers Network syndicated blog from Radware Blog authored by Richard Cohen. Read the original post at: https://blog.radware.com/security/2018/07/building-tier-1-ip-transit/
