How to cyber security: Leverage AST solution data to make risk-based decisions
AST solutions provide insights to help organizations make more-informed decisions about their security investments.

By now, everybody is familiar with the fundamental value of using application security testing (AST) solutions. You do security testing as part of a secure software development life cycle, you find security bugs, you fix them, and the software you release has a lower risk of being compromised, interrupted, or otherwise abused by attackers.
Unfortunately, the return on investment is not always as clear as it should be. Every bug you fix could be a big one—the bug that puts you on the map in a way you really didn’t want, or that costs you millions in lost revenue, or that pushes you out of business because your reputation is so badly damaged that nobody wants to buy your products or services.
But how do you quantify that? Executives don’t respond well to spending real money to reduce the probability of disaster.


Other questions are also important. How is your application security doing? Is it getting better or worse? How is your whole application portfolio looking from a security standpoint? Are you compliant with your own policies?
Fortunately, AST solutions produce a wealth of information that can be used to support decision-making, including evidence of the value of the AST tools themselves.
Three levels of decisions
Broadly speaking, decisions (and decision-makers) fall into three categories:
- Strategic decisions affect the whole organization. How are people and money allocated? What investments will be most effective at reducing risk?
- Operational decisions are related to keeping the organization running smoothly. For some organizations, this means demonstrating compliance with relevant standards or laws. It might also mean demonstrating the value of AST tools themselves.
- Tactical decisions are more about day-to-day work. They might include prioritizing work or making a determination if an application is ready to be released.
Synopsys tools have built-in dashboards and reports that satisfy many customers’ decision-making needs. For more customized needs, such as correlating results to other business data, our consulting team can work with you to build whatever you need to support risk-based decision-making.
This blog outlines a few of the possibilities to give you some idea of what can be done.
Dashboards and reports
The Polaris Software Integrity Platform® features a variety of dashboards and reports. For example, one dashboard gives a quick overview of application portfolio security based on the aggregated results of multiple testing tools.
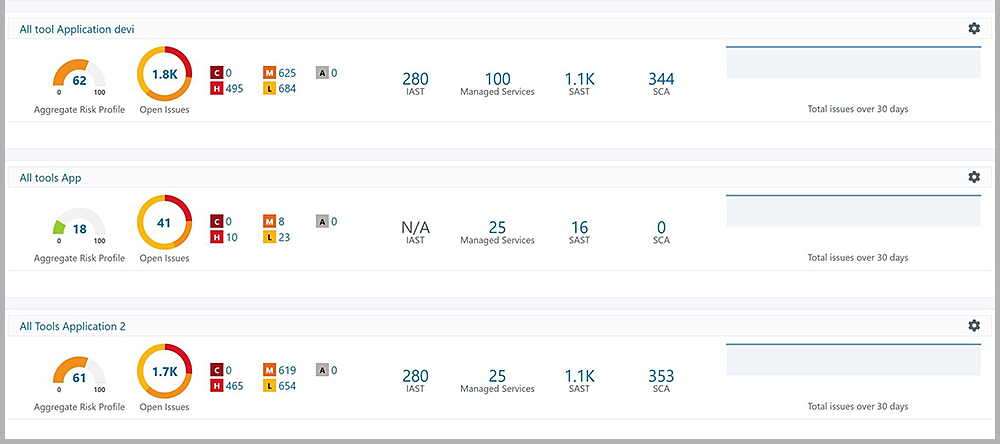
Each application has an overall score based on a configurable formula that takes into account the results returned from each type of security testing. A graph shows a color-coded view of the severity of the results: C is critical, H is high, M is medium, and L is low. Such a dashboard enables data-based decisions about where and how to allocate time and money.
Similarly, Synopsys Black Duck® offers a comprehensive application portfolio view of risk centered on third-party components and reflecting compliance with user-defined policies.
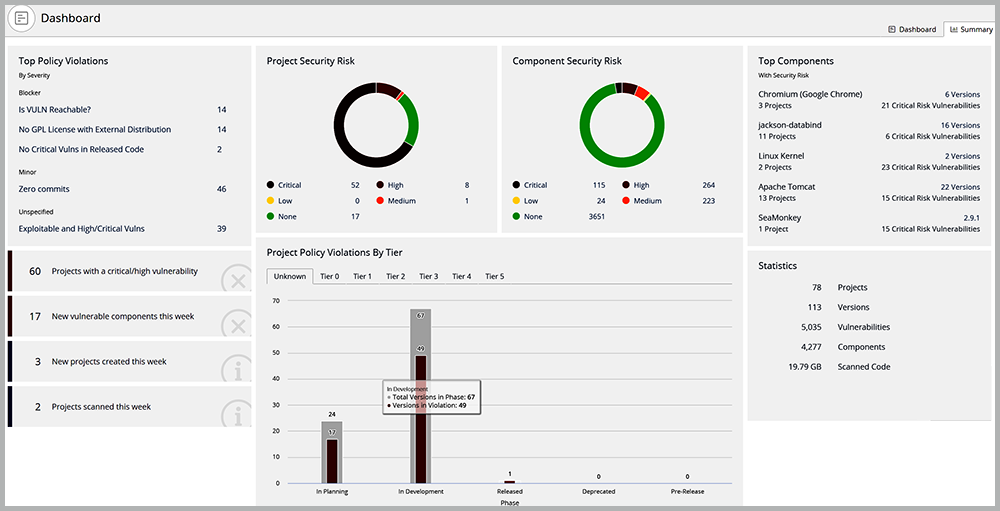
Black Duck shows the most-often-violated policies, which can help you decide how to set priorities and allocate resources. Circle graphs show risk from the perspective of applications (projects) as well as components. A risk-based list of components displays how each one is used across the entire application portfolio.
Working together to build what you need
Built-in dashboards and reports can enable many types of risk-based decision-making, and we can work with you to build anything you need. By pulling relevant data out of Synopsys tools using our APIs, we can create a solution customized to your needs.
In some cases, this means integrating data from Synopsys tools to the business intelligence solutions you’re already using, such as Power BI and Tableau. One advantage of this approach is that you can correlate security and risk data from Synopsys tools with any other available business data. For example, you could correlate your application security posture with support cases or development costs.
One way this can be useful is by examining time trends for applications. You can see an analysis of bug status over time, using data extracted from Synopsys tools.
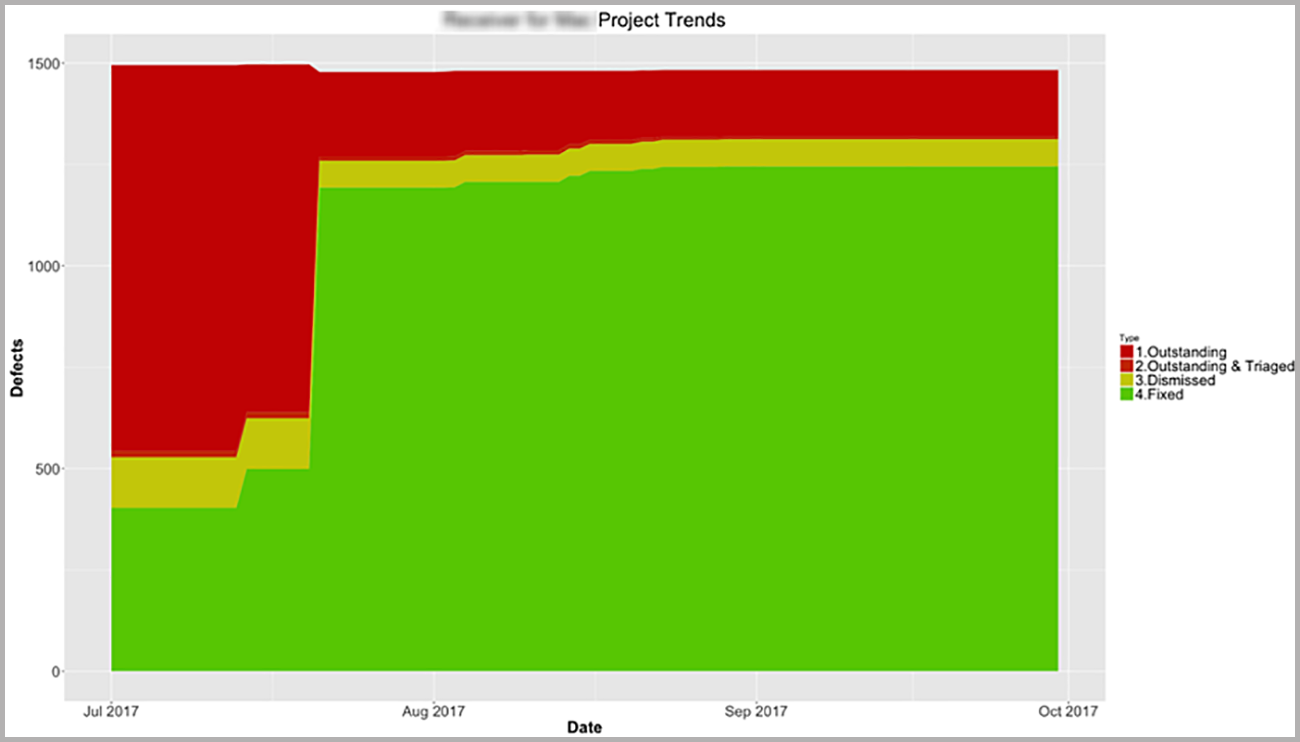
This type of data is extremely useful in understanding application health as well as in demonstrating the value that security testing is bringing. Every bug fixed is money saved.
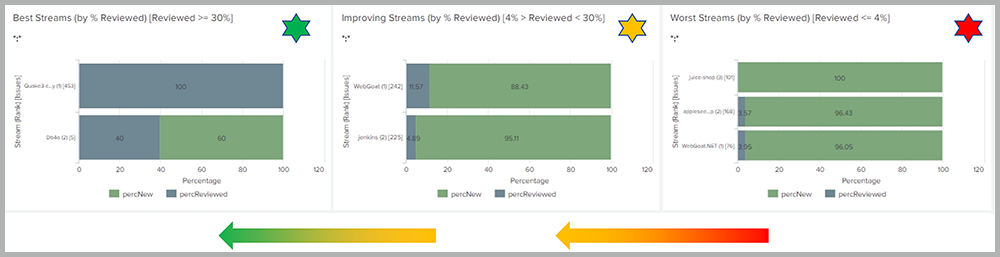
Another example integration is the view of application portfolio security. This view highlights the top-performing and bottom-performing application “streams,” which helps decision-makers determine priorities, how to allocate teams and budget, and so on.
Making sense of the data
Making good decisions is hard, which is the main reason that organization leaders get paid more than most. Making decisions based on data is almost always the smartest and safest route.
In the world of application security, AST solutions produce a huge amount of valuable data. By analyzing and visualizing the data, decision-makers can make smart choices about how to allocate time and money to most effectively reduce risk.
If developers are making the same kind of mistakes in multiple applications in the portfolio, get them specific training to reduce recurrence. If many applications use the same vulnerable version of an open source component, invest in narrowing the feedback loop between software composition analysis testing and development teams. If just one application produces most of your portfolio risk, consider steps to mitigate risk for that application.
The dashboards and reports built into Synopsys solutions enable this analysis and assist in making these types of decisions.
Beyond built-in dashboards and reports, we can work with you to build whatever you need, in whatever platform is comfortable, using whatever data is available.
Ultimately, reducing risk is about making good choices. Good choices are based on real data. Let us present the data in whatever form works best for you.
Get a complete view of application security risks
![]()
*** This is a Security Bloggers Network syndicated blog from Software Integrity Blog authored by Jonathan Knudsen. Read the original post at: https://www.synopsys.com/blogs/software-security/ast-solutions-data-insights/